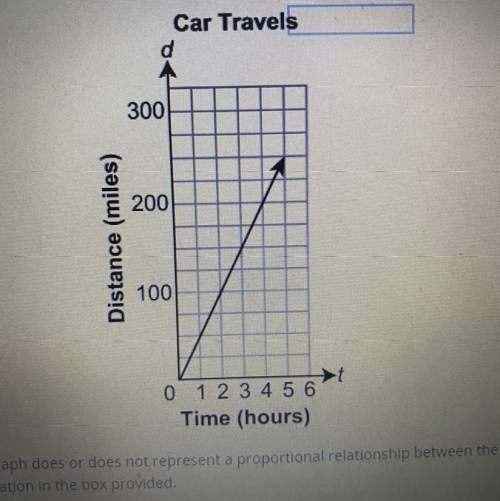
The graph shows the distance in miles, d, a car travels in hours.
(a)
Car Travels
d
300
200
Distance (miles)
100
0 1 2 3 4 5 6
Time (hours)
Explain why the graph does or does not represent a proportional relationship between the variables d and t.
Enter your explanation in the box provided.
Use the ratio test to determine whether ∑n=14∞n+2n! converges or diverges. (a) find the ratio of successive terms. write your answer as a fully simplified fraction. for n≥14, limn→∞∣∣∣an+1an∣∣∣=limn→∞.