
Mathematics, 22.03.2021 22:40 Reagan650
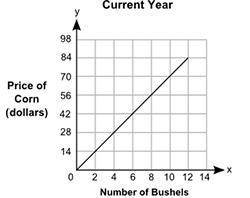
The graph shows the prices of different numbers of bushels of corn at a store in the current year. The table shows the prices of different numbers of bushels of corn at the same store in the previous year.
Table:
Previous Year
Number of Bushels
Price of Corn (dollars)
2
10
4
20
6
30
8
40
Part A: Describe in words how you can find the rate of change of a bushel of corn in the current year, and find the value. (5 points)
Part B: How many dollars more is the price of a bushel of corn in the current year than the price of a bushel of corn in the previous year? Show your work. (5 points)

Answers: 1


Another question on Mathematics
Mathematics, 21.06.2019 17:30
The swimming pool is open when the high temperature is higher than 20∘c. lainey tried to swim on monday and thursday (which was 33 days later). the pool was open on monday, but it was closed on thursday. the high temperature was 30 ∘c on monday, but decreased at a constant rate in the next 33 days. write an inequality to determine the rate of temperature decrease in degrees celsius per day, d, from monday to thursday.
Answers: 3
You know the right answer?
The graph shows the prices of different numbers of bushels of corn at a store in the current year. T...
Questions

Chemistry, 22.09.2021 02:40


Mathematics, 22.09.2021 02:40


Mathematics, 22.09.2021 02:40
Mathematics, 22.09.2021 02:40


