A
W
Y
x
B
Z
C с
In A ABC, X is the centroid.
If AX = 14x...

Mathematics, 18.03.2021 02:40 daymakenna3
A
W
Y
x
B
Z
C с
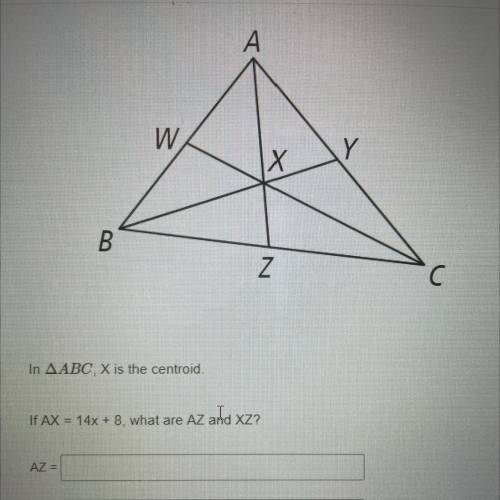
In A ABC, X is the centroid.
If AX = 14x + 8, what are AZ and XZ?
AZ =
XZ =

Answers: 1


Another question on Mathematics
Mathematics, 21.06.2019 15:30
The table respent two linear functions the equation respented by the first tables is given
Answers: 2
Mathematics, 21.06.2019 22:00
Asquare and an equilateral triangle have the same perimeter. each side the triangle is 4 inches longer than each side of the square. what is the perimeter of the square
Answers: 1
Mathematics, 22.06.2019 02:00
The half-life of a certain material is 0.004 second. approximately how much of a 20-gram sample will be left after 0.016 second? a. 5 grams b. 16 grams c. 0.32 gram d. 1.25 grams
Answers: 3
Mathematics, 22.06.2019 02:30
Atrain traveled for 1.5 hours to the first station, stopped for 30 minutes, then traveled for 4 hours to the final station where it stopped for 1 hour. the total distance traveled is a function of time. which graph most accurately represents this scenario? a graph is shown with the x-axis labeled time (in hours) and the y-axis labeled total distance (in miles). the line begins at the origin and moves upward for 1.5 hours. the line then continues upward at a slow rate until 2 hours. from 2 to 6 hours, the line continues quickly upward. from 6 to 7 hours, it moves downward until it touches the x-axis a graph is shown with the axis labeled time (in hours) and the y axis labeled total distance (in miles). a line is shown beginning at the origin. the line moves upward until 1.5 hours, then is a horizontal line until 2 hours. the line moves quickly upward again until 6 hours, and then is horizontal until 7 hours a graph is shown with the axis labeled time (in hours) and the y-axis labeled total distance (in miles). the line begins at the y-axis where y equals 125. it is horizontal until 1.5 hours, then moves downward until 2 hours where it touches the x-axis. the line moves upward until 6 hours and then moves downward until 7 hours where it touches the x-axis a graph is shown with the axis labeled time (in hours) and the y-axis labeled total distance (in miles). the line begins at y equals 125 and is horizontal for 1.5 hours. the line moves downward until 2 hours, then back up until 5.5 hours. the line is horizontal from 5.5 to 7 hours
Answers: 1
You know the right answer?
Questions
Mathematics, 09.12.2019 02:31
Mathematics, 09.12.2019 02:31

Mathematics, 09.12.2019 02:31
Mathematics, 09.12.2019 02:31


Mathematics, 09.12.2019 02:31


Biology, 09.12.2019 02:31
Social Studies, 09.12.2019 02:31


