
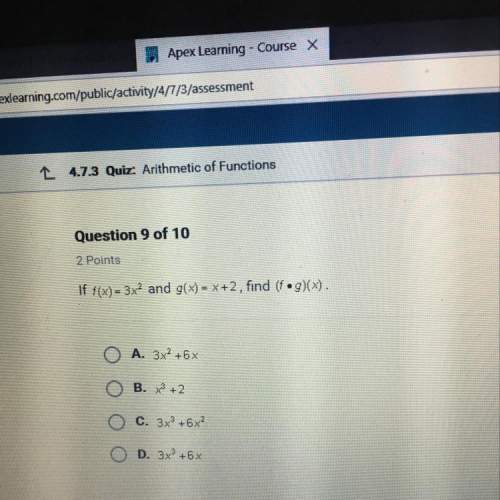
Mathematics, 13.03.2021 01:00 helen3327
Question 1
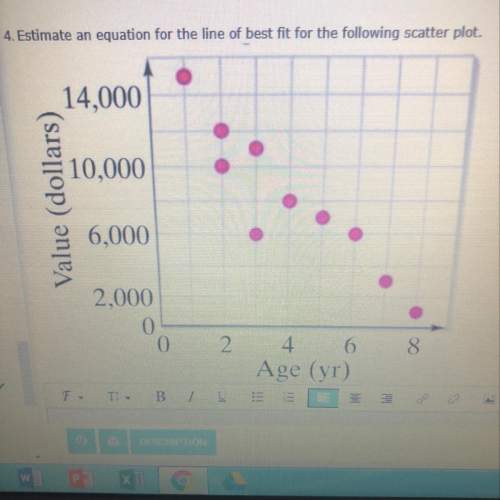
The following table shows the annual income, in dollars, and amount spent on vacation, in dollars, for a sample of 8 families.
(a) Create a scatterplot of the data in the table.
B) describe the association shown in the scatter plot created in part a
C) calculate the coefficient of determination for the data and interpret the value in context

Answers: 2


Another question on Mathematics
Mathematics, 20.06.2019 18:04
Approximately how many more job openings are expected for security guards than pharmacy technicians? a. 2,000 b. 11,100 c. 21,000 d. 32,000
Answers: 1
Mathematics, 21.06.2019 15:30
Complete the standard form of the equation that represents the quadratic relationship displayed above, where a, b, and c are rational numbers.
Answers: 1
Mathematics, 21.06.2019 21:00
How to write four times a number,minus 6,is equal to theee times the number+8 as an equqtion
Answers: 2
Mathematics, 21.06.2019 22:30
Assume that y varies inversely with x. if y=1.6 when x=0.5 find x when y=3.2 acellus answer
Answers: 2
You know the right answer?
Question 1
The following table shows the annual income, in dollars, and amount spent on vacation, i...
Questions


English, 26.09.2019 07:30
History, 26.09.2019 07:30

Social Studies, 26.09.2019 07:30

Mathematics, 26.09.2019 07:30
History, 26.09.2019 07:30

Health, 26.09.2019 07:30

Physics, 26.09.2019 07:30
Mathematics, 26.09.2019 07:30
Geography, 26.09.2019 07:30

Biology, 26.09.2019 07:30


