
Mathematics, 10.03.2021 01:00 hernan99961
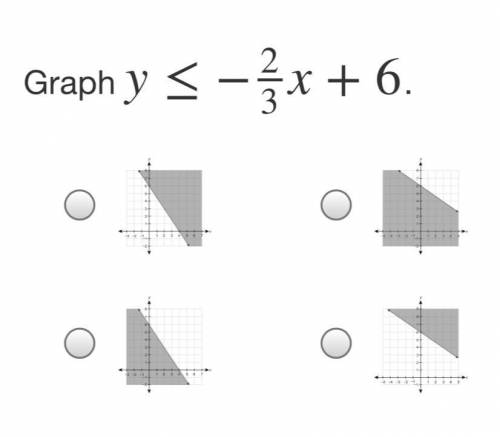
Graph y≤−23x+6.
The image shows a linear inequality graphed on a coordinate plane with increments of 1 and x axis ranging from negative 3 to 7 and y axis ranging from negative 2 to 8. A solid lines passes through the points begin ordered pair 0 comma 6 end ordered pair and begin ordered pair 4 comma 0 end ordered pair. The area above the line is shaded.
The image shows a linear inequality graphed on a coordinate plane with increments of 1 and x axis ranging from negative 5 to 5 and y axis ranging from negative 2 to 8. A solid lines passes through the points begin ordered pair 0 comma 6 end ordered pair and begin ordered pair 3 comma 4 end ordered pair. The area below the line is shaded.
The image shows a linear inequality graphed on a coordinate plane with increments of 1 and x axis ranging from negative 4 to 6 and y axis ranging from negative 2 to 8. A solid lines passes through the points begin ordered pair 0 comma 6 end ordered pair and begin ordered pair 4 comma 0 end ordered pair. The area below the line is shaded.
The image shows a linear inequality graphed on a coordinate plane with increments of 1 and x axis ranging from negative 5 to 5 and y axis ranging from negative 1 to 9. A solid lines passes through the points begin ordered pair 0 comma 6 end ordered pair and begin ordered pair 3 comma 4 end ordered pair. The area above the line is shaded.

Answers: 1


Another question on Mathematics
Mathematics, 21.06.2019 23:10
Astudent draws two parabolas on graph paper. both parabolas cross the x-axis at (–4, 0) and (6, 0). the y-intercept of the first parabola is (0, –12). the y-intercept of the second parabola is (0, –24). what is the positive difference between the a values for the two functions that describe the parabolas? write your answer as a decimal rounded to the nearest tenth
Answers: 2
Mathematics, 22.06.2019 00:30
Which graph of a hyperbola represents the equation 16x^2-y^2=16
Answers: 1
Mathematics, 22.06.2019 01:30
If you were constructing a triangular frame, and you had wood in the length of 4 inches, 4 inches, and 7 inches, would it make a triangle? would you be able to create a frame from these pieces of wood?
Answers: 2
Mathematics, 22.06.2019 01:50
Me asap the graph shows the relationship between the price of frozen yogurt and the number of ounces of frozen yogurt sold at different stores and restaurants according to the line of best fit about how many ounces of frozen yogurt can someone purchase for $5? 1 cost of frozen yogurt 1.5 2 13 15.5 cost (5) no 2 4 6 8 10 12 14 16 18 20 size (oz)
Answers: 1
You know the right answer?
Graph y≤−23x+6.
The image shows a linear inequality graphed on a coordinate plane with increments o...
Questions

History, 23.09.2020 23:01
History, 23.09.2020 23:01


English, 23.09.2020 23:01
Mathematics, 23.09.2020 23:01
Mathematics, 23.09.2020 23:01


Social Studies, 23.09.2020 23:01
History, 23.09.2020 23:01


