
Mathematics, 05.03.2021 21:10 morrowdrew
Which graph shows data that would allow the most accurate prediction for the number of water bottles a vendor sells based on the daily high temperature?
Graph A
Daily High Temperatures and Bottled Water Sales
On a graph, points are scattered all over the graph.
Graph B
Daily High Temperatures and Bottled Water Sales
On a graph, points are scattered all over the graph.
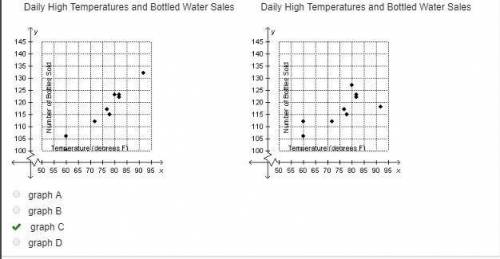
Graph C
Daily High Temperatures and Bottled Water Sales
On a graph, points are grouped together and form a line with positive slope.
Graph D
Daily High Temperatures and Bottled Water Sales
On a graph, points are grouped together and increase.
graph A
graph B
graph C
graph D

Answers: 2


Another question on Mathematics
Mathematics, 21.06.2019 12:30
Kenzie lives 30 kilometers from her cousin houde she drives 23 kilometers before stopping for gas how many meters does she need to travel
Answers: 1
Mathematics, 21.06.2019 17:00
The area of a rectangle is 54x^9y^8 square yards.if the length of the rectangle is 6x^3y^4 yards,which expression represents the width of the rectangle in yards
Answers: 2
You know the right answer?
Which graph shows data that would allow the most accurate prediction for the number of water bottles...
Questions


English, 03.03.2021 20:10


Chemistry, 03.03.2021 20:10
Biology, 03.03.2021 20:10
Mathematics, 03.03.2021 20:10
Mathematics, 03.03.2021 20:10

Computers and Technology, 03.03.2021 20:10


