
Mathematics, 25.02.2021 23:00 tibbs283
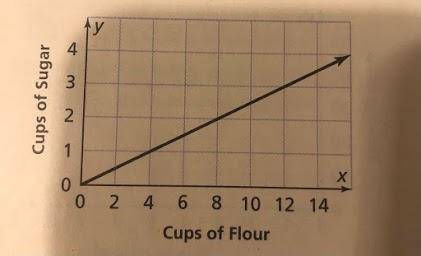
This graph shows the relationship between the number of cups of sugar and the number of cups of flour needed in a recipe. What point on the graph represents the number of cups of sugar that would be used with 8 cups of flour?
(8,2)
(2,8)
(8.5, 2.5)

Answers: 3


Another question on Mathematics
Mathematics, 21.06.2019 16:00
If myesha works overtime, she gets paid "time and a half" for every hour she works. in other words, for every hour over 40 hours myesha works each week, she gets her hourly pay plus half her hourly pay. what is myesha's pay per hour when she works overtime?
Answers: 1
Mathematics, 21.06.2019 21:30
Helll ! 1,400 tons of wheat of two different varieties was delivered to the silo. when processing one variety, there was 2% of waste and 3% during the processing of the second variety of wheat. after the processing, the amount of remaining wheat was 1,364 tons. how many tons of each variety of wheat was delivered to the silo?
Answers: 1
Mathematics, 22.06.2019 04:30
Roxanna earns 150% her normal hourly rate for overtime pay. last week, roxanna earned $72.00 in overtime pay for 4 hours. what is roxana's normal hourly pay?
Answers: 1
Mathematics, 22.06.2019 04:50
Q.1 dr. frank needs to choose 3 students from her advanced biology course to attend a conference in hawaii. the course has 40 students. which of the following methods could dr. frank use to choose a simple, random sample of 3 students? select all that apply. 1 dr. frank could have the students line up from shortest to tallest, then use her birthdate, 2/5/39, to select 3 students from the line (the 2nd student, the 5th student, and the 39th student). 2. dr. frank could upload her class roster into a spreadsheet and use a ranom-number generating function to produce 3 random numbers. the students whose names are located in the rows with these 3 numbers on the spreadsheet would be chosen. 3. dr. frank could choose the students with the 3 highest grades in the class. 4. dr. frank could count to three, then the first students to come to the front of the classroom and grab a golden ticket from her hand would be selected. 5. dr. frank could ask all students to write their name on a card, place all of the cards in a hat, shake the hat, and then pull 3 cards out from the hat. the students whose names appear on those 3 cards will be selected. 6. dr. frank could ask for volunteers to go to the conference, then choose the first 3 students who raise their hands. q2. now, choose one of the methods that you did not select and explain why this method would not result in a simple, random sample:
Answers: 2
You know the right answer?
This graph shows the relationship between the number of cups of sugar and the number of cups of flou...
Questions
Mathematics, 13.02.2021 03:20

History, 13.02.2021 03:20
Mathematics, 13.02.2021 03:20

Physics, 13.02.2021 03:20

English, 13.02.2021 03:20
English, 13.02.2021 03:20
History, 13.02.2021 03:20
History, 13.02.2021 03:20
Mathematics, 13.02.2021 03:20
Mathematics, 13.02.2021 03:20

Mathematics, 13.02.2021 03:20


