
Mathematics, 13.02.2021 18:40 hanahspeers
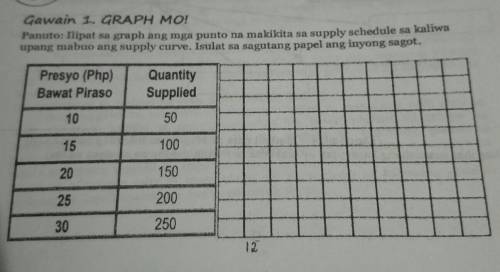
Gawain 1. GRAPH MO!
Panuto: Ilipat sa graph ang mga punto na makikita sa supply schedule sa kaliwa
upang mabuo ang supply curve. Isulat sa sagutang papel ang inyong sagot.
Presyo (Php)
Bawat Piraso
Quantity
Supplied
10
50
15
100
20
150
25
200
30
250
12

Answers: 3


Another question on Mathematics
Mathematics, 21.06.2019 17:30
When a rectangle is dilated, how do the perimeter and area of the rectangle change?
Answers: 2
Mathematics, 21.06.2019 23:20
Which shows a reasonable estimation for 124% of 42 using the distributive property?
Answers: 1
Mathematics, 22.06.2019 01:00
The stem-and-leaf plot shows the heights in centimeters of teddy bear sunflowers grown in two different types of soil. soil a soil b 5 9 5 2 1 1 6 3 9 5 1 0 7 0 2 3 6 7 8 2 1 8 3 0 9 key: 9|6 means 69 key: 5|8 means 58 calculate the mean of each data set. calculate the mean absolute deviation (mad) of each data set. which set is more variable? how do you know?
Answers: 2
Mathematics, 22.06.2019 02:00
Reading tests are compared for two students. sara got 98, 100, 65, 78, 98, 46, 100, 100, 45, and 50 on her reading test. lee got 97, 67, 89, 99, 100, 45, 79, 89, 58, and 67 on his reading test.
Answers: 1
You know the right answer?
Gawain 1. GRAPH MO!
Panuto: Ilipat sa graph ang mga punto na makikita sa supply schedule sa kaliwa<...
Questions


Computers and Technology, 05.09.2019 19:30


