
Mathematics, 12.02.2021 07:20 Yvette538
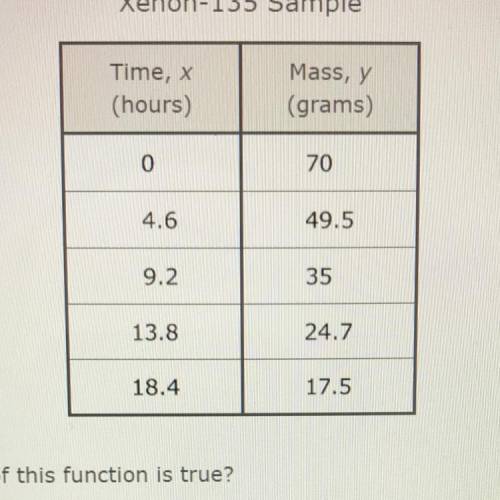
The table represents some points on the graph of the exponential function that models the radioactive decay of a
sample of xenon-135.
Xenon-135 Sample
Time, x
(hours)
Mass, y
(grams)
0
70
4.6
49.5
9.2
35
13.8
24.7
18.4
17.5
Which statement about the graph of this function is true?

Answers: 2


Another question on Mathematics
Mathematics, 21.06.2019 21:30
Which equation shows the variable terms isolated on one side and the constant terms isolated on the other side for the equation -1/2x+3=4-1/4x? a. -1/4x=1 b. -3/4x=1 c. 7=1/4x d. 7=3/4x
Answers: 1
Mathematics, 21.06.2019 23:30
The bottom of ignacio's desktop is 74.5cm from the floor. ignacios sits in his adjustable chair, and the tops of his legs are 49.3cm from the floor. each clockwise rotation of the knob on the chair raises ignacio's legs by 4.8cm. write an inequality to determine the number of clockwise rotations, r, ignacio could make with the knob without his legs touching the desk.
Answers: 3
You know the right answer?
The table represents some points on the graph of the exponential function that models the radioactiv...
Questions

Social Studies, 21.07.2019 17:00


Geography, 21.07.2019 17:00
Mathematics, 21.07.2019 17:00
Mathematics, 21.07.2019 17:00

Advanced Placement (AP), 21.07.2019 17:00

History, 21.07.2019 17:00
Mathematics, 21.07.2019 17:00


Chemistry, 21.07.2019 17:00
Spanish, 21.07.2019 17:00

Spanish, 21.07.2019 17:00
Mathematics, 21.07.2019 17:00


