
Mathematics, 10.02.2021 01:40 netflixacc0107
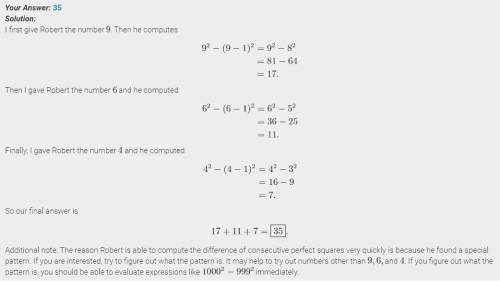
I have a friend Robert who is an expert at taking the difference of consecutive perfect squares. This means that if I give him a number $x$, he immediately computes $$x^2 - (x - 1)^2$$and gives me the result. I decided one day to first give Robert the number $9$, then the number $6$, and finally the number $4$. Robert gave me three numbers in return. What is the sum of these three numbers?

Answers: 2


Another question on Mathematics
Mathematics, 21.06.2019 20:30
Apinhole camera is made out of a light-tight box with a piece of film attached to one side and pinhole on the opposite side. the optimum diameter d(in millimeters) of the pinhole can be modeled by d=1.9[ (5.5 x 10^-4) l) ] ^1/2, where l is the length of the camera box (in millimeters). what is the optimum diameter for a pinhole camera if the camera box has a length of 10 centimeters
Answers: 1
Mathematics, 21.06.2019 20:30
Pyramid shown has a square base that is 18 inches on each side has a surface area of 164 square inches what is the slant height
Answers: 3
Mathematics, 21.06.2019 23:00
Frank has a devised a formula for his catering business that calculates the number of meatballs he needs to prepare. the formula is m=4a+2c, where c=number of children; m=number of meatballs; a=number of adults. how many meatballs are required for a party of 10 adults and 5 children?
Answers: 1
Mathematics, 22.06.2019 03:00
Describe how the presence of possible outliers might be identified on the following. (a) histograms gap between the first bar and the rest of bars or between the last bar and the rest of bars large group of bars to the left or right of a gap higher center bar than surrounding bars gap around the center of the histogram higher far left or right bar than surrounding bars (b) dotplots large gap around the center of the data large gap between data on the far left side or the far right side and the rest of the data large groups of data to the left or right of a gap large group of data in the center of the dotplot large group of data on the left or right of the dotplot (c) stem-and-leaf displays several empty stems in the center of the stem-and-leaf display large group of data in stems on one of the far sides of the stem-and-leaf display large group of data near a gap several empty stems after stem including the lowest values or before stem including the highest values large group of data in the center stems (d) box-and-whisker plots data within the fences placed at q1 â’ 1.5(iqr) and at q3 + 1.5(iqr) data beyond the fences placed at q1 â’ 2(iqr) and at q3 + 2(iqr) data within the fences placed at q1 â’ 2(iqr) and at q3 + 2(iqr) data beyond the fences placed at q1 â’ 1.5(iqr) and at q3 + 1.5(iqr) data beyond the fences placed at q1 â’ 1(iqr) and at q3 + 1(iqr)
Answers: 1
You know the right answer?
I have a friend Robert who is an expert at taking the difference of consecutive perfect squares. Thi...
Questions
Mathematics, 15.04.2021 06:20
Mathematics, 15.04.2021 06:20
Mathematics, 15.04.2021 06:20
Mathematics, 15.04.2021 06:20
Mathematics, 15.04.2021 06:20
Mathematics, 15.04.2021 06:20


English, 15.04.2021 06:20

Chemistry, 15.04.2021 06:20

Mathematics, 15.04.2021 06:20

History, 15.04.2021 06:20


