
Mathematics, 07.02.2021 01:50 sirdre1982
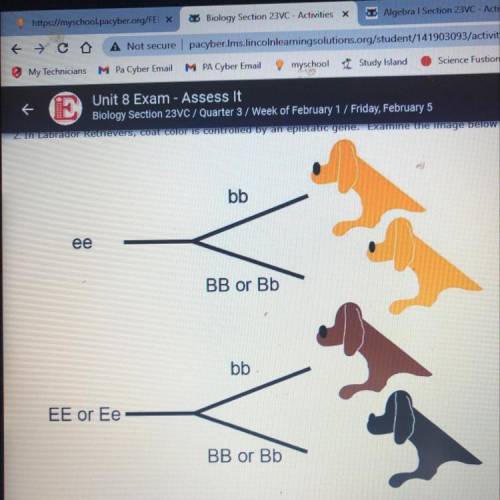
In Labrador Retrievers, coat color is controlled by a epistatic gene. Explain the image below to determine which gene is epistatic and controls the phenotypic expression of the other.
A.) Gene “E” (EE, Ee, or ee) is the epistatic gene
B.) it cannot be determined from this image
C.) Gene “B” is the epistatic gene
D.) the genotype “bb” is epistatic

Answers: 3


Another question on Mathematics
Mathematics, 21.06.2019 18:30
The table shows the relationship between the number of cups of cereal and the number of cups of raisins in a cereal bar recipe: number of cups of cereal number of cups of raisins 8 2 12 3 16 4 molly plotted an equivalent ratio as shown on the grid below: a graph is shown. the title of the graph is cereal bars. the horizontal axis label is cereal in cups. the x-axis values are 0, 20, 40, 60, 80,100. the vertical axis label is raisins in cups. the y-axis values are 0, 10, 20, 30, 40, 50. a point is plotted on the ordered pair 40,20. which of these explains why the point molly plotted is incorrect? (a) if the number of cups of cereal is 40, then the number of cups of raisins will be10. (b)if the number of cups of raisins is 40, then the number of cups of cereal will be10. (c) if the number of cups of cereal is 40, then the number of cups of raisins will be 80. (d) if the number of cups of raisins is 40, then the number of cups of cereal will be 80.
Answers: 1
Mathematics, 22.06.2019 01:30
Drag the tiles to the boxes to form correct pairs. not all tiles will be used with reference to the figure, match the angles and arcs to their measures. *dpa 124 e0b 114° cob spot xoca 122° c e 2019 orentum arts reserved a 6: 52 pm 6/19/2019 40
Answers: 1
Mathematics, 22.06.2019 01:50
If its non of them tell me..valerie took a day-trip. she drove from her house for a while and took a coffee break. after her coffee break, she continued driving. after 2 hours of driving after her coffee break, her distance from her house was 210 miles. her average speed during the whole trip was 60 miles per hour.valerie created the equation y−210=60(x−2) to represent this situation, where xx represents the time in hours from her coffee break and yy represents the distance in miles from her house.which graph correctly represents valerie's distance from her house after her coffee break?
Answers: 1
Mathematics, 22.06.2019 03:20
What is an equation of the line that is perpendicular to y=-x+3 and passes through the point (4, 12)? enter your equation in the box. basic
Answers: 1
You know the right answer?
In Labrador Retrievers, coat color is controlled by a epistatic gene. Explain the image below to det...
Questions
Mathematics, 12.11.2020 20:20

English, 12.11.2020 20:20

Social Studies, 12.11.2020 20:20
English, 12.11.2020 20:20
Mathematics, 12.11.2020 20:20

English, 12.11.2020 20:20

Biology, 12.11.2020 20:20
Mathematics, 12.11.2020 20:20
Mathematics, 12.11.2020 20:20
Social Studies, 12.11.2020 20:20
Mathematics, 12.11.2020 20:20

Spanish, 12.11.2020 20:20

Mathematics, 12.11.2020 20:20

History, 12.11.2020 20:20


