
Mathematics, 06.02.2021 01:00 cratsley321
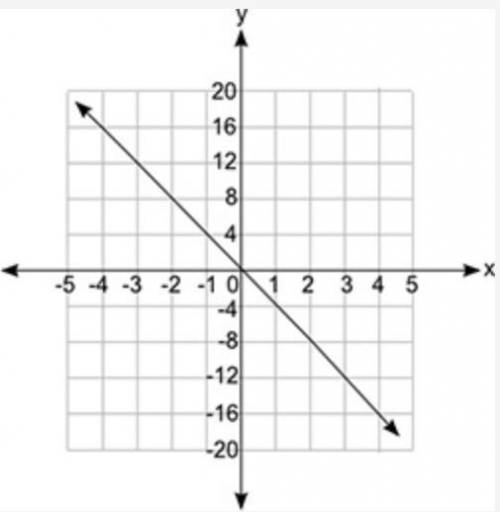
Which equation does the graph below represent?
A coordinate grid is shown. The x axis values are from negative 5 to positive 5 in increments of 1 for each grid line, and the y axis values are from negative 20 to positive 20 in increments of 4 for each grid line. A line is shown passing through the ordered pairs negative 4, 16 and 0, 0 and 4, negative 16.
y = fraction 1 over 4x
y = 4x
y = fraction negative 1 over 4x
y = −4x

Answers: 1


Another question on Mathematics
Mathematics, 21.06.2019 21:20
52 cm radius = diameter = area = circumference = circumfer
Answers: 1
Mathematics, 21.06.2019 21:30
Madeline takes her family on a boat ride. going through york canal, she drives 6 miles in 10 minutes. later on as she crosses stover lake, she drives 30 minutes at the same average speed. which statement about the distances is true?
Answers: 3
You know the right answer?
Which equation does the graph below represent?
A coordinate grid is shown. The x axis values are fr...
Questions

Mathematics, 14.07.2019 07:00
Mathematics, 14.07.2019 07:00

Chemistry, 14.07.2019 07:00

Mathematics, 14.07.2019 07:00
Biology, 14.07.2019 07:00


