See attached graph
Step-by-step explanation:
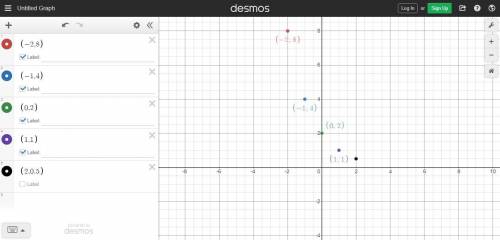
The table values should be treated as coordinates and the plotted on grid to visualize the graph;
The coordinates are : (-2,8), (-1,4 ) , (0,2) ,(1,1 ) , ( 2,0.5)
Join the plotted points to form a curve that slants to the left and compare with the answer choices given.