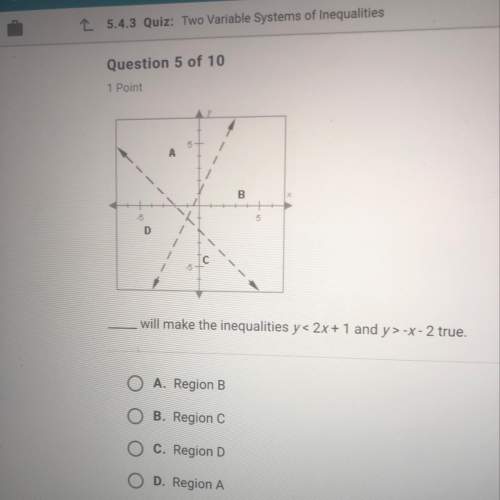
region b will make the inequalities y < 2x + 1 and y > -x - 2 true ⇒ answer a
step-by-step explanation:
* lets study the graph and the inequality to solve the question
- the inequality y > -x - 2
∵ the form of the inequality is y > mx + c , m is the slope of the line
and c is the y-intercept (the line intersect y-axis at point (0 , c)
∴ c = -2 that means the line intersect the y-axis at point (0 , -2)
∵ the sign of the inequality is >
∴ we shad the part over the line
region a and b
- the inequality y < 2x + 1
∵ the form of the inequality is y > mx + c , m is the slope of the line
and c is the y-intercept (the line intersect y-axis at point (0 , c)
∴ c = 1 that means the line intersect the y-axis at point (0 , 1)
∵ the sign of the inequality is <
∴ we shad the part under the line
region b and c
∵ the common region between the two lines is region b
∴ region b will make the inequalities y < 2x + 1 and y > -x - 2 true