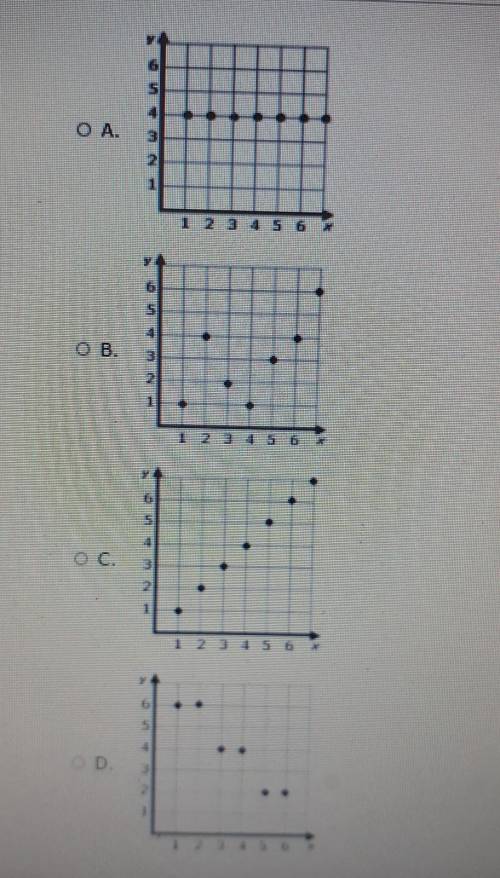
Which of the following graphs shows a rate of change of zero?
...

Mathematics, 29.01.2021 18:30 katherinevandehei
Which of the following graphs shows a rate of change of zero?

Answers: 2


Another question on Mathematics
Mathematics, 20.06.2019 18:04
What is the rescursive formula for this geometric sequence? 7, -14, 28, -56
Answers: 2
Mathematics, 21.06.2019 17:30
The ksp expression for the system pbcl2(s) pb+2(aq) + 2 cl-(aq) is: [pbc12][pb+2][2cl-] [pb+2][cl-]2 [pb+2][2cl-]2 [pbcl2][pb+2][cl-]2 [pb+2][2cl-]2[pbcl2]
Answers: 1
Mathematics, 22.06.2019 00:50
Astudent is determining the influence of different types of food on the growth rate of spiders. she feeds one group of spiders two caterpillars twice a week. the other group received similarly-sized beetles twice a week. she records the amount of time required for individuals to reach sexual maturity. her hypothesis is that the spiders feeding on caterpillars will have a faster growth rate because caterpillars have a higher protein content compared to beetles. in this experiment, what is the dependent variable? spiders assigned to different feeding groups. time required to reach sexual maturity number of prey items fed twice a week. growth rates of each group.
Answers: 2
Mathematics, 22.06.2019 02:00
1. the manager of collins import autos believes the number of cars sold in a day (q) depends on two factors: (1) the number of hours the dealership is open (h) and (2) the number of salespersons working that day (s). after collecting data for two months (53 days), the manager estimates the following log-linear model: q 4 equation 1 a. explain, how to transform the log-linear model into linear form that can be estimated using multiple regression analysis. the computer output for the multiple regression analysis is shown below: q4 table b. how do you interpret coefficients b and c? if the dealership increases the number of salespersons by 20%, what will be the percentage increase in daily sales? c. test the overall model for statistical significance at the 5% significance level. d. what percent of the total variation in daily auto sales is explained by this equation? what could you suggest to increase this percentage? e. test the intercept for statistical significance at the 5% level of significance. if h and s both equal 0, are sales expected to be 0? explain why or why not? f. test the estimated coefficient b for statistical significance. if the dealership decreases its hours of operation by 10%, what is the expected impact on daily sales?
Answers: 2
You know the right answer?
Questions

Business, 22.10.2021 02:20

Social Studies, 22.10.2021 02:20

English, 22.10.2021 02:30


History, 22.10.2021 02:30

Mathematics, 22.10.2021 02:30
Social Studies, 22.10.2021 02:30
Mathematics, 22.10.2021 02:40

Arts, 22.10.2021 02:40

Physics, 22.10.2021 02:50
Biology, 22.10.2021 03:00


