
Mathematics, 27.01.2021 01:00 elliswilliams1063
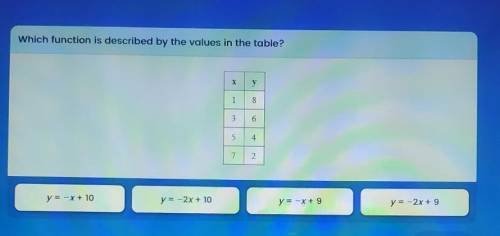
Which function is described by the values in the table? A у 1 8 3 6 5 4 7 2 y = -x + 10 y=-2x + 10 y=-x+ 9 y = -2x + 9

Answers: 2


Another question on Mathematics
Mathematics, 21.06.2019 19:40
Which system of linear inequalities is represented by the graph?
Answers: 1
Mathematics, 21.06.2019 20:30
If you are dealt 4 cards from a shuffled deck of 52? cards, find the probability that all 4 cards are diamondsdiamonds.
Answers: 1
Mathematics, 21.06.2019 21:30
In a test for esp (extrasensory perception), the experimenter looks at cards that are hidden from the subject. each card contains either a star, a circle, a wave, a cross or a square.(five shapes) as the experimenter looks at each of 20 cards in turn, the subject names the shape on the card. when the esp study described above discovers a subject whose performance appears to be better than guessing, the study continues at greater length. the experimenter looks at many cards bearing one of five shapes (star, square, circle, wave, and cross) in an order determined by random numbers. the subject cannot see the experimenter as he looks at each card in turn, in order to avoid any possible nonverbal clues. the answers of a subject who does not have esp should be independent observations, each with probability 1/5 of success. we record 1000 attempts. which of the following assumptions must be met in order to solve this problem? it's reasonable to assume normality 0.8(1000), 0.2(1000)%30 approximately normal 0.8(1000), 0.2(1000)% 10 approximately normal srs it is reasonable to assume the total number of cards is over 10,000 it is reasonable to assume the total number of cards is over 1000
Answers: 1
Mathematics, 21.06.2019 23:00
Each of the following data sets has a mean of x = 10. (i) 8 9 10 11 12 (ii) 7 9 10 11 13 (iii) 7 8 10 12 13 (a) without doing any computations, order the data sets according to increasing value of standard deviations. (i), (iii), (ii) (ii), (i), (iii) (iii), (i), (ii) (iii), (ii), (i) (i), (ii), (iii) (ii), (iii), (i) (b) why do you expect the difference in standard deviations between data sets (i) and (ii) to be greater than the difference in standard deviations between data sets (ii) and (iii)? hint: consider how much the data in the respective sets differ from the mean. the data change between data sets (i) and (ii) increased the squared difference îł(x - x)2 by more than data sets (ii) and (iii). the data change between data sets (ii) and (iii) increased the squared difference îł(x - x)2 by more than data sets (i) and (ii). the data change between data sets (i) and (ii) decreased the squared difference îł(x - x)2 by more than data sets (ii) and (iii). none of the above
Answers: 2
You know the right answer?
Which function is described by the values in the table? A у 1 8 3 6 5 4 7 2 y = -x + 10 y=-2x + 10 y...
Questions
Mathematics, 03.08.2020 19:01


Chemistry, 03.08.2020 19:01
Mathematics, 03.08.2020 19:01
Mathematics, 03.08.2020 19:01

Health, 03.08.2020 19:01
Mathematics, 03.08.2020 19:01
Mathematics, 03.08.2020 19:01


