
Mathematics, 14.01.2021 23:10 Worldprofessor6252
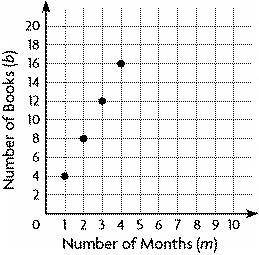
The graph shows the relationship between the number of months, m, and the number of books, b, Ivan has read.
Which list best represents the dependent values of the graphed points?
a
1, 2, 3, 4
b
4, 8, 12, 16
c
2, 4, 6, 8, 10, 12, 14, 16
d
1, 4, 2, 8, 3, 12, 4, 16

Answers: 1


Another question on Mathematics
Mathematics, 21.06.2019 19:30
What is the image of c for a 90° counterclockwise rotation about a? (3, 7) (-1, 3) (7, 3)
Answers: 1
Mathematics, 22.06.2019 01:00
Given the net of the rectangular prism, what is its surface area?
Answers: 1
You know the right answer?
The graph shows the relationship between the number of months, m, and the number of books, b, Ivan h...
Questions
Mathematics, 05.05.2020 09:07


Physics, 05.05.2020 09:07

English, 05.05.2020 09:07
English, 05.05.2020 09:07
English, 05.05.2020 09:07

History, 05.05.2020 09:07

Medicine, 05.05.2020 09:07
Mathematics, 05.05.2020 09:07
Mathematics, 05.05.2020 09:07
Mathematics, 05.05.2020 09:07
Mathematics, 05.05.2020 09:07

Biology, 05.05.2020 09:07
Physics, 05.05.2020 09:07


