
Mathematics, 14.01.2021 09:30 tasiajm
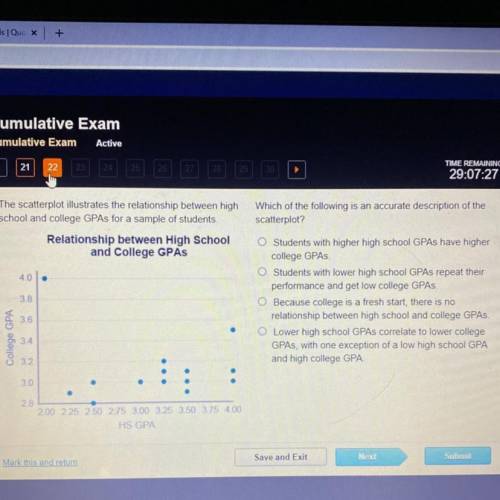
The scatterplot illustrates the relationship between high
school and college GPAs for a sample of students.
Which of the following is an accurate description of the
scatterplot?
Relationship between High School
and College GPAS
4.0
3.8
Students with higher high school GPAs have higher
college GPAs.
O Students with lower high school GPAs repeat their
performance and get low college GPAs.
O Because college is a fresh start, there is no
relationship between high school and college GPAs.
O Lower high school GPAs correlate to lower college
GPAs, with one exception of a low high school GPA
and high college GPA.
3.6
College GPA
3.4
32
3.0
2.8
200 225 2.50 2.75 3.00 3.25 3.50 3.75 4.00
HS GPA
Mark this and return
Save and Exit
Next
Submit

Answers: 2


Another question on Mathematics
Mathematics, 21.06.2019 13:30
Based upon past experience, barry expects no overdrafts. he expects no 2nd copies of statements. barry estimates that he will use network atms about 5 times a month with either bank. barry decides in the end to choose eecu. assuming that both banks provide the necessary services equally well, and based upon the tables of fees given above, how much can barry reasonably expect to save annually by choosing eecu in this case over e-town bank? a. $72 b. $78 c. $144 d. $24
Answers: 2
Mathematics, 21.06.2019 15:00
Achemist has 200 ml of a 10% sucrose solution. she adds x ml of a 40% sucrose solution. the percent concentration, y, of the final mixture is given by the rational function: the chemist needs the concentration of the final mixture to be 30%. how many milliliters of the 40% solution should she add to the 10% solution to get this concentration?
Answers: 1
Mathematics, 21.06.2019 16:00
What is the solution to the system of equations? (–2, –8) (–1, –5) (0, –2) (2, 4)
Answers: 3
Mathematics, 21.06.2019 18:30
Draw a tape diagram to represent each situation.for some of the situations,you need to decide what to represent with a variable andre bakes 9 pans of brownies.he donates 7 pans to the school bake sale and keeps the rest to divide equally among his class of 30 students
Answers: 2
You know the right answer?
The scatterplot illustrates the relationship between high
school and college GPAs for a sample of s...
Questions


Mathematics, 16.12.2020 01:30

Chemistry, 16.12.2020 01:30
Mathematics, 16.12.2020 01:30
Biology, 16.12.2020 01:30

Social Studies, 16.12.2020 01:30
Mathematics, 16.12.2020 01:30
Mathematics, 16.12.2020 01:30
Mathematics, 16.12.2020 01:30
Mathematics, 16.12.2020 01:30


