
Mathematics, 05.01.2021 02:50 abelxoconda
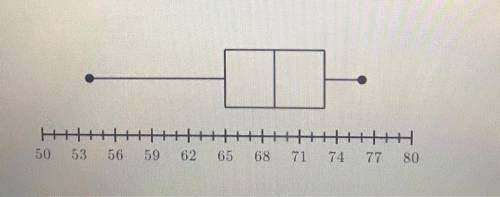
Which data set could be represented by the box plot shown below?
A. 54, 60, 65, 66, 67, 69, 70, 72, 73, 75, 76
B. 54, 60, 63, 66, 67, 68, 70, 72, 73, 75, 76
C. 54, 60, 65, 66, 67, 70, 72, 73, 75, 76
D. 53, 60, 65, 66, 67, 69, 70, 72, 73, 75, 76

Answers: 1


Another question on Mathematics
Mathematics, 21.06.2019 21:00
List x1, x2, x3, x4 where xi is the midpoint endpoint of the five equal intervals used to estimate the area under the curve of f(x) between x = 0 and x = 10.
Answers: 1
Mathematics, 21.06.2019 22:00
1) prove that 731^3−631^3 is divisible by 100 2) prove that 99^3−74^3 is divisible by 25
Answers: 2
You know the right answer?
Which data set could be represented by the box plot shown below?
A. 54, 60, 65, 66, 67, 69, 70, 72,...
Questions

History, 05.11.2019 04:31

Biology, 05.11.2019 04:31
History, 05.11.2019 04:31
History, 05.11.2019 04:31


English, 05.11.2019 04:31

Health, 05.11.2019 04:31

History, 05.11.2019 04:31


