
Mathematics, 02.01.2021 04:30 ayoismeisalex
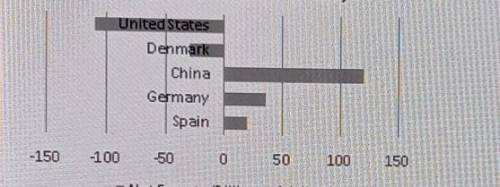
The bar graph in the following graphic represents fictional net exports in billions of dollars for five countries. Net exports are obtained by subtracting total imports from total exports; a negative net export means the country imported more goods than it exported.
Net Exports (Billions of dollars) United States Denmark China Germany Spain -150 -100 -50 0 50 100 150 Net Exports (Billions of dollars) Estimate the net amount of exports for Spain.
a. 10 billion dollars
b. 30 billion dollars
C. -20 billion dollars
d. 20 billion dollars
Please select the best answer from the choices provided Save and Exit Next Submit Mark this and return

Answers: 2


Another question on Mathematics
Mathematics, 21.06.2019 21:20
Find the distance from the theater to the library. leave your answer in simplest radical form if necessary. 12 √12 74 √74
Answers: 2
Mathematics, 21.06.2019 22:00
How many solutions does the nonlinear system of equations graphed below have? a. one b. zero c. four d. two
Answers: 2
Mathematics, 22.06.2019 03:20
The equation ip| = 2 represents the total number of points that can be earned or lost during one turn of a game. which best describes how many points can be earned or lost during one turn?
Answers: 3
Mathematics, 22.06.2019 04:40
The formula for the area of a regular polygon is a=1/2ap . what is the equation solved for a?
Answers: 2
You know the right answer?
The bar graph in the following graphic represents fictional net exports in billions of dollars for f...
Questions


History, 25.11.2021 06:10

English, 25.11.2021 06:10


Mathematics, 25.11.2021 06:10
History, 25.11.2021 06:10
History, 25.11.2021 06:10


