
Mathematics, 23.12.2020 07:00 isac58
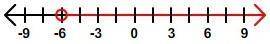
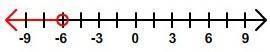
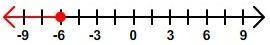
Which of the number lines is the correct graph for the inequality x < -6?


Answers: 2


Another question on Mathematics
Mathematics, 21.06.2019 20:30
Aswimming pool had 2.5 million liters of water in it. some water evaporated, and then the pool only had 22 million liters of water in it. what percent of the water evaporated?
Answers: 2
Mathematics, 22.06.2019 00:40
The point (-7, -24) is on the terminal ray of angle 0 which is in standard position. a student found the six trigonometric values for angle e. the student's answers are shown. which value(s) are incorrect? sin(8) cos(8) 24 tan(0) sin(0)=25 cos(0) -- tan(ⓡ) - - 24 csc(o)=2 sec(0) --25 cot(6) - za csc(o) sec(0) cot(0) done
Answers: 3
Mathematics, 22.06.2019 01:30
The difference between the number of electoral votes for florida and north carolina is 12 votes. write and solve a subtraction equation to find a number of electoral votes for florida.
Answers: 3
You know the right answer?
Which of the number lines is the correct graph for the inequality x < -6?
Questions
Mathematics, 27.01.2021 01:00


Biology, 27.01.2021 01:00


Physics, 27.01.2021 01:00


Mathematics, 27.01.2021 01:00
SAT, 27.01.2021 01:00


