
Mathematics, 22.12.2020 18:20 minideeri
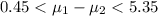
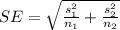
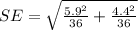
A randomized trial tested the effectiveness of diets on adults. Among 36 subjects using Diet 1, the mean weight loss after a year was 3.5 pounds with a standard deviation of 5.9 pounds. Among 36 subjects using Diet 2, the mean weight loss after a year was 0.6 pounds with a standard deviation of 4.4 pounds. Construct a 95% confidence interval estimate of the difference between the population means, assuming the population standard deviations are equal.

Answers: 2


![df = \frac{ [ \frac{s_1^2 }{n_1 } + \frac{s_2^2 }{n_2} ]^2 }{ \frac{1}{(n_1 - 1 )} [ \frac{s_1^2}{n_1} ]^2 + \frac{1}{(n_2 - 1 )} [ \frac{s_2^2}{n_2} ]^2 }](/tpl/images/1005/5248/8861e.png)
![df = \frac{ [ \frac{5.9^2 }{34 } + \frac{4.4^2 }{34} ]^2 }{ \frac{1}{(34 - 1 )} [ \frac{5.9^2}{34} ]^2 + \frac{1}{(34- 1 )} [ \frac{4.4^2}{ 34} ]^2 }](/tpl/images/1005/5248/3b874.png)


Another question on Mathematics
Mathematics, 21.06.2019 19:30
Asurvey of 2,000 doctors showed that an average of 3 out of 5 doctors use brand x aspirin.how many doctors use brand x aspirin
Answers: 1
Mathematics, 21.06.2019 20:00
Question 3 (essay worth 10 points) (03.06 mc) part a: max rented a motorbike at $465 for 5 days. if he rents the same motorbike for a week, he has to pay a total rent of $625. write an equation in the standard form to represent the total rent (y) that max has to pay for renting the motorbike for x days. (4 points) part b: write the equation obtained in part a using function notation. (2 points) part c: describe the steps to graph the equation obtained above on the coordinate axes. mention the labels on the axes and the intervals. (4 points)
Answers: 1
Mathematics, 21.06.2019 20:30
Barbara has a good credit history and is able to purchase a car with a low-interest car loan. she co-signs a car loan for her friend jen, who has poor credit history. then, jen defaults on the loan. who will be held legally responsible by the finance company and why? select the best answer from the choices provided. a. barbara will be held legally responsible because she has a good credit history. b. jen will be held legally responsible because she drives the car. c. barbara will be held legally responsible because she is the co-signer. d. jen will be held legally responsible because she has a poor credit history. the answer is a
Answers: 3
Mathematics, 21.06.2019 22:00
The two box p digram the two box plots show the data of the pitches thrown by two pitchers throughout the season. which statement is correct? check all that apply. pitcher 1 has a symmetric data set. pitcher 1 does not have a symmetric data set. pitcher 2 has a symmetric data set. pitcher 2 does not have a symmetric data set. pitcher 2 has the greater variation.ots represent the total number of touchdowns two quarterbacks threw in 10 seasons of play
Answers: 1
You know the right answer?
A randomized trial tested the effectiveness of diets on adults. Among 36 subjects using Diet 1, the...
Questions


English, 10.03.2021 01:00

History, 10.03.2021 01:00
Mathematics, 10.03.2021 01:00
English, 10.03.2021 01:00
Mathematics, 10.03.2021 01:00
English, 10.03.2021 01:00
Mathematics, 10.03.2021 01:00

Social Studies, 10.03.2021 01:00

Mathematics, 10.03.2021 01:00
Mathematics, 10.03.2021 01:00
Mathematics, 10.03.2021 01:00
Mathematics, 10.03.2021 01:00


