
Mathematics, 17.12.2020 14:00 jeffersonpaul283
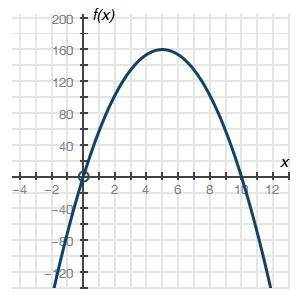
The graph below shows a company's profit f(x), in dollars, depending on the price of pencils x, in dollars, sold by the company:
Graph of quadratic function f of x having x intercepts at ordered pairs negative 0, 0 and 10, 0. The vertex is at 5, 160.
Part A: What do the x-intercepts and maximum value of the graph represent? What are the intervals where the function is increasing and decreasing, and what do they represent about the sale and profit? (4 points)
Part B: What is an approximate average rate of change of the graph from x = 2 to x = 5, and what does this rate represent? (3 points)
Part C: Describe the constraints of the domain. (3 points)

Answers: 2


Another question on Mathematics
Mathematics, 21.06.2019 21:30
Are the corresponding angles congruent? explain why or why not.
Answers: 2
You know the right answer?
The graph below shows a company's profit f(x), in dollars, depending on the price of pencils x, in d...
Questions
Mathematics, 08.07.2021 17:30
Mathematics, 08.07.2021 17:30


Computers and Technology, 08.07.2021 17:30

Computers and Technology, 08.07.2021 17:30
Mathematics, 08.07.2021 17:30
Computers and Technology, 08.07.2021 17:30

Mathematics, 08.07.2021 17:30

Biology, 08.07.2021 17:40


