
Mathematics, 25.11.2020 01:00 lukeakalucas
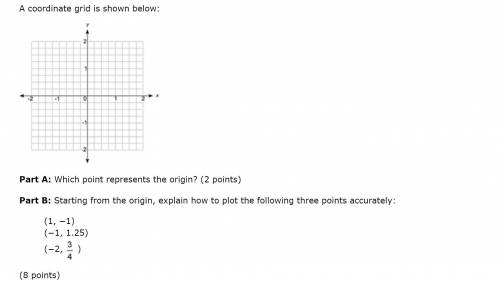
A coordinate grid is shown below: A coordinate grid from negative 2 to 0 to positive 2 is drawn. There are three grid lines between a whole unit on the grid. Part A: Which point represents the origin? (2 points) Part B: Starting from the origin, explain how to plot the following three points accurately: (1, −1) (−1, 1.25) (−2, fraction 3 over 4 )

Answers: 1


Another question on Mathematics
Mathematics, 21.06.2019 20:00
Need ! the total ticket sales for a high school basketball game were $2,260. the ticket price for students were $2.25 less than the adult ticket price. the number of adult tickets sold was 230, and the number of student tickets sold was 180. what was the price of an adult ticket?
Answers: 1
Mathematics, 21.06.2019 21:00
Acomposition of transformations maps δxyz to δx"y"z". the first transformation for this composition is , and the second transformation is a 90° rotation about point x'.
Answers: 1
Mathematics, 21.06.2019 21:30
Name and describe the three most important measures of central tendency. choose the correct answer below. a. the mean, sample size, and mode are the most important measures of central tendency. the mean of a data set is the sum of the observations divided by the middle value in its ordered list. the sample size of a data set is the number of observations. the mode of a data set is its highest value in its ordered list. b. the sample size, median, and mode are the most important measures of central tendency. the sample size of a data set is the difference between the highest value and lowest value in its ordered list. the median of a data set is its most frequently occurring value. the mode of a data set is sum of the observations divided by the number of observations. c. the mean, median, and mode are the most important measures of central tendency. the mean of a data set is the product of the observations divided by the number of observations. the median of a data set is the lowest value in its ordered list. the mode of a data set is its least frequently occurring value. d. the mean, median, and mode are the most important measures of central tendency. the mean of a data set is its arithmetic average. the median of a data set is the middle value in its ordered list. the mode of a data set is its most frequently occurring value.
Answers: 3
Mathematics, 21.06.2019 22:20
Which graph has figures that can undergo a similarity transformation to justify that they are similar? (obviously not the third one)
Answers: 2
You know the right answer?
A coordinate grid is shown below: A coordinate grid from negative 2 to 0 to positive 2 is drawn. The...
Questions
Mathematics, 08.02.2021 23:20
Mathematics, 08.02.2021 23:20

Spanish, 08.02.2021 23:20
Mathematics, 08.02.2021 23:20


Mathematics, 08.02.2021 23:20

Chemistry, 08.02.2021 23:20
Mathematics, 08.02.2021 23:20

Business, 08.02.2021 23:20
Chemistry, 08.02.2021 23:20

Geography, 08.02.2021 23:20
Mathematics, 08.02.2021 23:20
Biology, 08.02.2021 23:20


