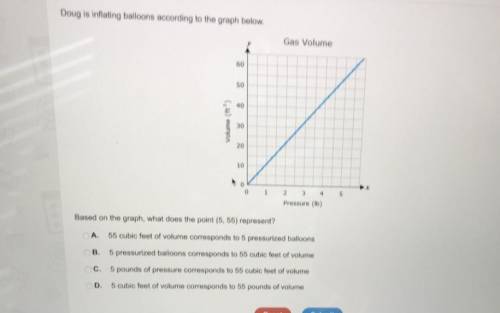
Doug is inflating balloons according to the graph below.
Gas Volume
60
50
40
Volume (ft)
30
20
10
0 1 2 3 4 5
Pressure (lb)
Based on the graph, what does the point (5, 55) represent?
A. 55 cubic feet of volume corresponds to 5 pressurized balloons
B. 5 pressurized balloons corresponds to 55 cubic feet of volume
C. 5 pounds of pressure corresponds to 55 cubic feet of volume
D. 5 cubic feet of volume corresponds to 55 pounds of volume
Abby is collecting rainfall data. she finds that one value of the data set is a high-value outlier. which statement must be true? abby will use a different formula for calculating the standard deviation. the outlier will increase the standard deviation of the data set. the spread of the graph of the data will not change. abby will not use the mean when calculating the standard deviation.