
Mathematics, 17.11.2020 07:10 connie2168
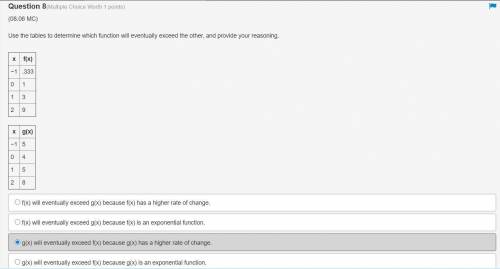
Use the tables to determine which function will eventually exceed the other, and provide your reasoning.
View image.
x f(x)
−1 .333
0 1
1 3
2 9
x g(x)
−1 5
0 4
1 5
2 8
Options:
A.) f(x) will eventually exceed g(x) because f(x) has a higher rate of change.
B.) f(x) will eventually exceed g(x) because f(x) is an exponential function.
C.) g(x) will eventually exceed f(x) because g(x) has a higher rate of change.
D.) g(x) will eventually exceed f(x) because g(x) is an exponential function.

Answers: 1


Another question on Mathematics
Mathematics, 22.06.2019 00:30
Tim tradesman pays $2,000 annually for $125,000 worth of life insurance. what is the cash value of the policy after 10 years? 11,125 13,125 17,800 111,250
Answers: 2
Mathematics, 22.06.2019 01:30
The box plots show the distributions of the numbers of words per line in an essay printed in two different fonts.which measure of center would be best to compare the data sets? the median is the best measure because both distributions are left-skewed.the mean is the best measure because both distributions are left-skewed.the median is the best measure because both distributions are symmetric.the mean is the best measure because both distributions are symmetric
Answers: 1
Mathematics, 22.06.2019 02:10
You use technology ans find a sum of 6.712e-8. write this sum in standard form
Answers: 1
Mathematics, 22.06.2019 02:30
Atrain traveled for 1.5 hours to the first station, stopped for 30 minutes, then traveled for 4 hours to the final station where it stopped for 1 hour. the total distance traveled is a function of time. which graph most accurately represents this scenario? a graph is shown with the x-axis labeled time (in hours) and the y-axis labeled total distance (in miles). the line begins at the origin and moves upward for 1.5 hours. the line then continues upward at a slow rate until 2 hours. from 2 to 6 hours, the line continues quickly upward. from 6 to 7 hours, it moves downward until it touches the x-axis a graph is shown with the axis labeled time (in hours) and the y axis labeled total distance (in miles). a line is shown beginning at the origin. the line moves upward until 1.5 hours, then is a horizontal line until 2 hours. the line moves quickly upward again until 6 hours, and then is horizontal until 7 hours a graph is shown with the axis labeled time (in hours) and the y-axis labeled total distance (in miles). the line begins at the y-axis where y equals 125. it is horizontal until 1.5 hours, then moves downward until 2 hours where it touches the x-axis. the line moves upward until 6 hours and then moves downward until 7 hours where it touches the x-axis a graph is shown with the axis labeled time (in hours) and the y-axis labeled total distance (in miles). the line begins at y equals 125 and is horizontal for 1.5 hours. the line moves downward until 2 hours, then back up until 5.5 hours. the line is horizontal from 5.5 to 7 hours
Answers: 1
You know the right answer?
Use the tables to determine which function will eventually exceed the other, and provide your reason...
Questions

History, 13.05.2021 23:20

Computers and Technology, 13.05.2021 23:20
Mathematics, 13.05.2021 23:20


Spanish, 13.05.2021 23:20
Business, 13.05.2021 23:20
Mathematics, 13.05.2021 23:20

Mathematics, 13.05.2021 23:20
Mathematics, 13.05.2021 23:20


