
Mathematics, 13.11.2020 21:50 10040813
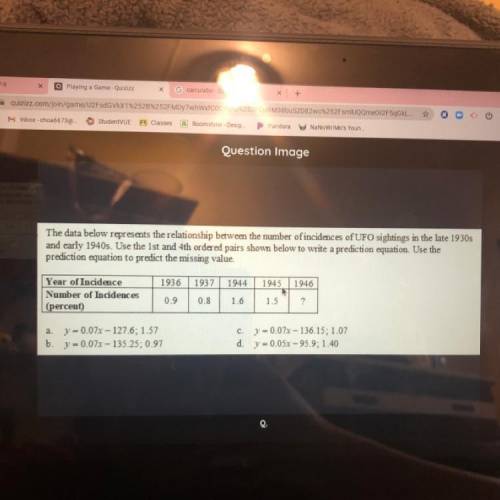
The data below represents the relationship between the mumber of incidences of UFO sightings in the late 1930s
and early 1940s. Use the 1st and 4th ordered pairs shown below to write a prediction equation. Use the
prediction equation to predict the missing value
1936
1937
1944
1945
1946
Year of Incidence
Number of Incidences
(percent)
0.9
0.8
1.6
1.5
?
a
y = 0.07x-127.6: 1.57
y = 0.07x-135.25, 0.97
c. y = 0.07x - 136.15: 1.07
d y = 0.05x - 95.9; 1.40
b.

Answers: 1


Another question on Mathematics
Mathematics, 21.06.2019 22:00
Arefrigeration system at your company uses temperature sensors fixed to read celsius (°c) values, but the system operators in your control room understand only the fahrenheit scale. you have been asked to make a fahrenheit (°f) label for the high temperature alarm, which is set to ring whenever the system temperature rises above –10°c. what fahrenheit value should you write on the label?
Answers: 3
Mathematics, 21.06.2019 22:00
In dire need~! describe how to use area models to find the quotient 2/3 divided by 1/5. check your work by also finding the quotient 2/3 divided by 1/5 using numerical operations only.
Answers: 1
Mathematics, 21.06.2019 23:50
Which function has the domain x> -11? y= x+ 11 +5 y= x-11 +5 y= x+5 - 11 y= x+5 + 11
Answers: 2
Mathematics, 22.06.2019 01:30
Pllz me also i will report if you are in for the 1. complete the table by converting each decimal to a fraction. repeating decimals. 0.31 0.125 0.1607 2. describe any patterns you noticed when converting the decimals in the table above.
Answers: 1
You know the right answer?
The data below represents the relationship between the mumber of incidences of UFO sightings in the...
Questions


History, 21.09.2020 09:01
Physics, 21.09.2020 09:01
Mathematics, 21.09.2020 09:01

Biology, 21.09.2020 09:01

Mathematics, 21.09.2020 09:01


Mathematics, 21.09.2020 09:01
Chemistry, 21.09.2020 09:01
Mathematics, 21.09.2020 09:01


