
Mathematics, 04.11.2020 22:40 mireyagonzaless6395
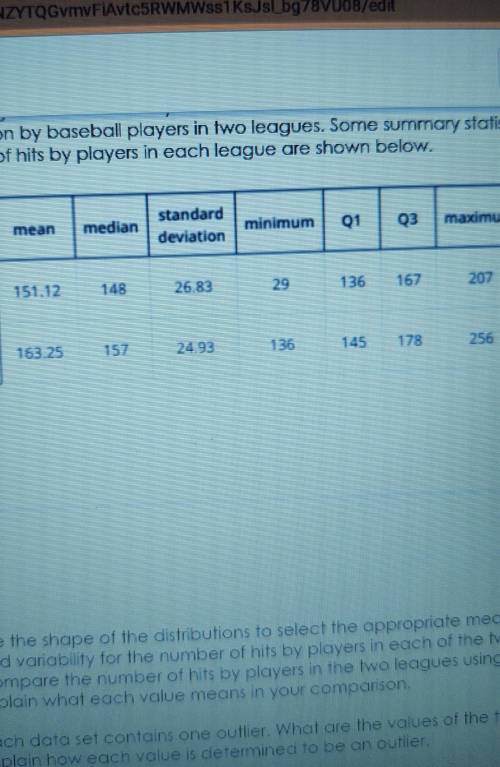
The histograms and summary statistics summarize the data for the number of hits in the season by baseball players in two leads. some summaries statistics for the number of hits by players in each league are shown below.
use the shape of the distributions to select the appropriate measures of center and variability for the number of hits by players in each of the two leagues. compare the number of hits by players in the two leagues using these measures explain what each value means in your comparison
(league A is the top row and B is the bottom row, my apologies they wouldn't fit)

Answers: 2


Another question on Mathematics
Mathematics, 21.06.2019 15:50
Do a swot analysis for the business idea you chose in question 2 above. describe at least 2 strengths, 2 weaknesses, 2 opportunities, and 2 threats for that company idea. (1-8 sentences. 4.0 points)
Answers: 1
Mathematics, 21.06.2019 19:10
Girardo is using the model below to solve the equation . girardo uses the following steps: step 1 add 4 negative x-tiles to both sides step 2 add 1 negative unit tile to both sides step 3 the solution is which step could be adjusted so that gerardo's final step results in a positive x-value? in step 1, he should have added 4 positive x-tiles to both sides. in step 1, he should have added 3 negative x-tiles to both sides. in step 2, he should have added 4 negative unit tiles to both sides. in step 2, he should have added 1 positive unit tile to both sides.
Answers: 2
Mathematics, 21.06.2019 21:00
Ian is in training for a national hot dog eating contest on the 4th of july. on his first day of training, he eats 4 hot dogs. each day, he plans to eat 110% of the number of hot dogs he ate the previous day. write an explicit formula that could be used to find the number of hot dogs ian will eat on any particular day.
Answers: 3
Mathematics, 22.06.2019 00:00
(20 points) a bank has been receiving complaints from real estate agents that their customers have been waiting too long for mortgage confirmations. the bank prides itself on its mortgage application process and decides to investigate the claims. the bank manager takes a random sample of 20 customers whose mortgage applications have been processed in the last 6 months and finds the following wait times (in days): 5, 7, 22, 4, 12, 9, 9, 14, 3, 6, 5, 15, 10, 17, 12, 10, 9, 4, 10, 13 assume that the random variable x measures the number of days a customer waits for mortgage processing at this bank, and assume that x is normally distributed. 2a. find the sample mean of this data (x ě…). 2b. find the sample variance of x. find the variance of x ě…. for (c), (d), and (e), use the appropriate t-distribution 2c. find the 90% confidence interval for the population mean (îľ). 2d. test the hypothesis that îľ is equal to 7 at the 95% confidence level. (should you do a one-tailed or two-tailed test here? ) 2e. what is the approximate p-value of this hypothesis?
Answers: 2
You know the right answer?
The histograms and summary statistics summarize the data for the number of hits in the season by bas...
Questions


Mathematics, 03.12.2021 21:00

Social Studies, 03.12.2021 21:00


Mathematics, 03.12.2021 21:00


Chemistry, 03.12.2021 21:00
Mathematics, 03.12.2021 21:00
History, 03.12.2021 21:00
Biology, 03.12.2021 21:00

Computers and Technology, 03.12.2021 21:00

Law, 03.12.2021 21:00
Chemistry, 03.12.2021 21:00


