
Mathematics, 30.10.2020 21:50 LilCookies1
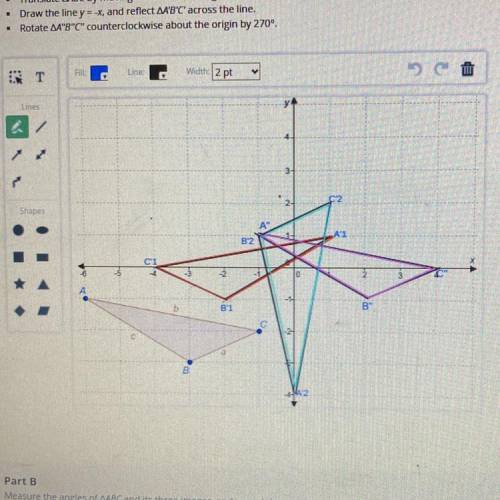
Part C measure the lengths of the sides of triangle ABC and its three images and record the measurements in the table. Part D how do the measures of the sides and angles of triangle ABC compare with the corresponding measurements in the three images.

Answers: 1


Another question on Mathematics
Mathematics, 22.06.2019 01:00
Which is an accurate comparison of the two data sets? the commute to work is typically shorter and more consistent than the commute home. the commute to work is typically shorter but less consistent than the commute home. the commute to work is typically longer and less consistent than the commute home. the commute to work is typically longer but more consistent than the commute home.
Answers: 2
Mathematics, 22.06.2019 01:30
Use the given degree of confidence and sample data to construct a confidence interval for the population mean mu . assume that the population has a normal distribution. a laboratory tested twelve chicken eggs and found that the mean amount of cholesterol was 185 milligrams with sequals 17.6 milligrams. a confidence interval of 173.8 mgless than muless than 196.2 mg is constructed for the true mean cholesterol content of all such eggs. it was assumed that the population has a normal distribution. what confidence level does this interval represent?
Answers: 1
Mathematics, 22.06.2019 03:00
A. the probability that a product is defective is 0.1. what is the probability that there will be 1 or less defective products out of the next 8 produced products b.the expected number of imperfections in the coating nylon for parachutes is 6 per 100 yards. what is the probability of finding 12 or fewer imperfections in 260 yards c.in a lot of 54 products there are 9 defective products. calculate the probability that not more than 1 is defective from a random sample of 17 products.
Answers: 1
Mathematics, 22.06.2019 03:20
Given a normal distribution with µ =50 and σ =4, what is the probability that 5% of the values are less than what x values? between what two x values (symmetrically distributed around the mean) are 95 % of the values? instructions: show all your work as to how you have reached your answer. don’t simply state the results. show graphs where necessary.
Answers: 3
You know the right answer?
Part C measure the lengths of the sides of triangle ABC and its three images and record the measurem...
Questions
Mathematics, 21.04.2020 00:25


Business, 21.04.2020 00:30


History, 21.04.2020 00:30
Mathematics, 21.04.2020 00:30
Mathematics, 21.04.2020 00:30

Mathematics, 21.04.2020 00:30
Mathematics, 21.04.2020 00:30


