
Mathematics, 23.10.2020 19:50 heysonic91
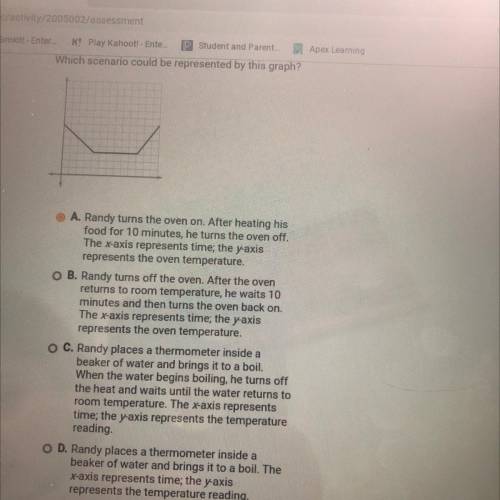
Which scenario could be represented by this graph?
O A. Randy turns the oven on. After heating his
food for 10 minutes, he turns the oven off.
The xaxis represents time; the yaxis
represents the oven temperature
O B. Randy turns off the oven. After the oven
returns to room temperature, he waits 10
minutes and then turns the oven back on.
The x-axis represents time; the yaxis
represents the oven temperature.
O C. Randy places a thermometer inside a
beaker of water and brings it to a boil.
When the water begins boiling, he turns off
the heat and waits until the water returns to
room temperature. The axis represents
time, the yaxis represents the temperature
reading
O D. Randy places a thermometer inside a
beaker of water and brings it to a boil. The
xaxis represents time; the y-axis
represents the temperature reading
APEX plz help I need tons of help if u don’t mind:(
I give extra points

Answers: 3


Another question on Mathematics
Mathematics, 21.06.2019 23:30
Line u passes through points (-52, -18) and (-29, 53). line v passes through points (90, 33) and (19, 56). are line u and line v parallel or perpendicular?
Answers: 1
Mathematics, 22.06.2019 00:00
Need plz been trying to do it for a long time and still haven’t succeeded
Answers: 1
Mathematics, 22.06.2019 01:00
Urgent? will give brainliest to the first correct answer what is the area of the figure?
Answers: 3
You know the right answer?
Which scenario could be represented by this graph?
O A. Randy turns the oven on. After heating his<...
Questions

Business, 23.02.2021 01:50

Social Studies, 23.02.2021 01:50


Chemistry, 23.02.2021 01:50
Mathematics, 23.02.2021 01:50
Mathematics, 23.02.2021 01:50
Mathematics, 23.02.2021 01:50

History, 23.02.2021 01:50

English, 23.02.2021 01:50

History, 23.02.2021 01:50
History, 23.02.2021 01:50
Mathematics, 23.02.2021 01:50
History, 23.02.2021 01:50
Mathematics, 23.02.2021 01:50


