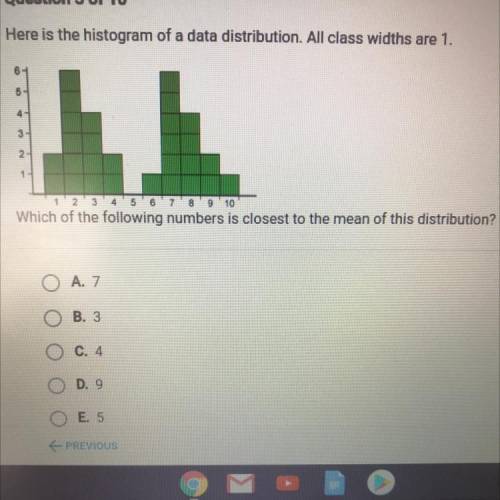
Here is the histogram of a data distribution. All class widths are 1.
6
5
4
3
2.
2
3
4 5 6
7 8 9 10
Which of the following numbers is closest to the mean of this distribution?
Bill and felicia each bake cookies for a party. bill bakes 3 times as many cookies as felicia. felicia bakes 24 fewer cookies than bill. bill bakes b cookies and felicia bakes f cookies. what equation can represent this word problem