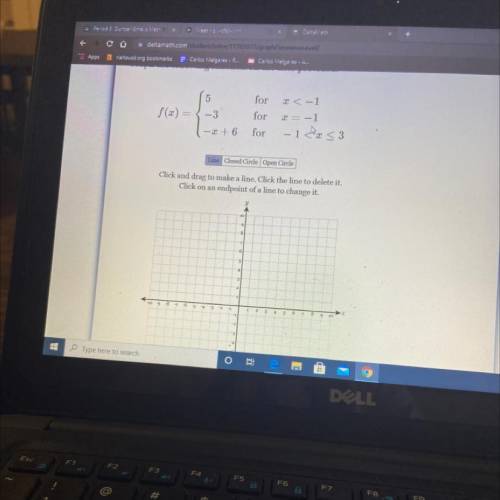
Graph the following function on the axes provided.
5
x < -1
for
for
-3
-2 +6
for
-1<3 <3
Line Closed Cirele Open Cirele
Click and drag to make a line. Click the line to delete it.
Click on an endpoint of a line to change it.
10
8
0
At store a, erasers are sold individually. the cost y of x erasers is represented by the equation y=0.75x. the costs of erasers at store b are shown in the graph.