
Mathematics, 13.10.2020 03:01 jcox626
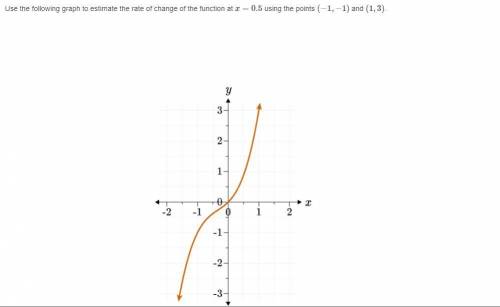
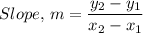
2.Use the following graph to estimate the rate of change of the function at x=0.5 using the points (−1,−1) and (1,3)
A. The rate of change is −1/2.
B. The rate of change is 2.
C. The rate of change is 1/2.
D. The rate of change is −2.
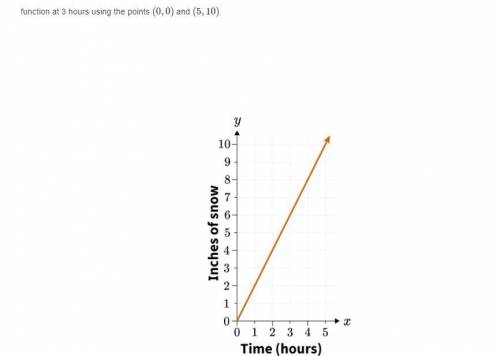
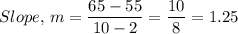
3.The following graph shows the inches of snow on the ground over a certain number of hours. Use the graph to estimate the rate of change of the function at 3 hours using the points (0,0) and (5,10)
A. The rate of change is −1/2 of an inch per hour.
B. The rate of change is 1/2 of an inch per hour.
C. The rate of change is 2 inches per hour.
D. The rate of change is −2 inches per hour.
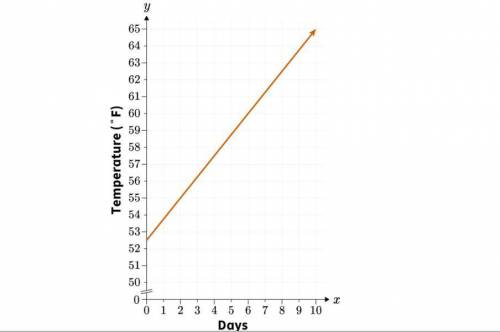
4.The following graph shows the average temperatures in degrees Fahrenheit (°F) over the days of a month. Use the graph to estimate the rate of change of the function at the ninth day of the month using the points (2,55) and (10,65)
A. The rate of change is 0.8 degrees Fahrenheit per day.
B. The rate of change is 1.25 degrees Fahrenheit per day.
C. The rate of change is −0.8 degrees Fahrenheit per day.
D. The rate of change is −1.25 degrees Fahrenheit per day.
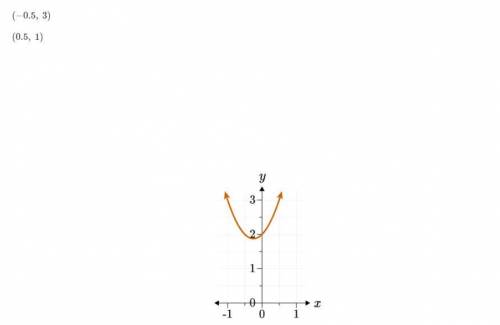
5.Use the following graph to answer which of the following points would provide the most accurate estimation for the rate of change of the function as it crosses the y-axis. Explain.
(−0.5, 2)
(0.5, 3)
(−0.5, 3)
(0.5, 1)
A.(−0.5, 3) and (0.5, 1) would provide the most accurate estimation. The slope of the line drawn between these two points appears closest to the slope of the function at x=0.
B.(−0.5, 2) and (0.5, 3) would provide the most accurate estimation. The slope of the line drawn between these two points appears closest to the opposite of the slope of the function at x=0.
C.(−0.5, 2) and (0.5, 3) would provide the most accurate estimation. The slope of the line drawn between these two points appears closest to the slope of the function at x=0.
D.(−0.5, 3) and (0.5, 1) would provide the most accurate estimation. The slope of the line drawn between these two points appears closest to the opposite of the slope of the function at x=0.

Answers: 3


Another question on Mathematics
Mathematics, 21.06.2019 12:40
Given the graph below state whether or not the relation is a function, and give the domain and range.
Answers: 3
Mathematics, 21.06.2019 18:30
Aswimming pool had 2.5 million liters of water in it. some water evaporated, and then the pool only had 22 million liters of water in it. what percent of the water evaporated?
Answers: 1
Mathematics, 21.06.2019 20:00
Someone answer asap for ! the total ticket sales for a high school basketball game were $2,260. the ticket price for students were $2.25 less than the adult ticket price. the number of adult tickets sold was 230, and the number of student tickets sold was 180. what was the price of an adult ticket?
Answers: 1
Mathematics, 22.06.2019 00:30
Which ordered pair identifies a point in quadrant iv? a) (2, 5) b) (0, 1) c) (-1, -1) d) (12, -5) which quadrant is (-4,-6) in? a) i. b) ii. c) iii. d) iv.
Answers: 3
You know the right answer?
2.Use the following graph to estimate the rate of change of the function at x=0.5 using the points (...
Questions


English, 11.02.2021 02:40


English, 11.02.2021 02:40


Physics, 11.02.2021 02:40
Mathematics, 11.02.2021 02:40
Mathematics, 11.02.2021 02:40
Engineering, 11.02.2021 02:40
Mathematics, 11.02.2021 02:40
Chemistry, 11.02.2021 02:40


