
Mathematics, 12.10.2020 22:01 glyptictriton9575
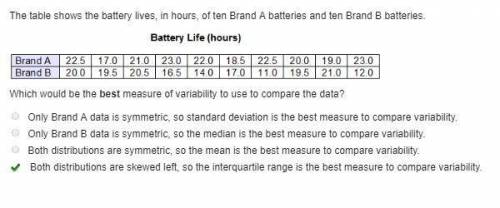
The table shows the battery lives, in hours, of ten Brand A batteries and ten Brand B batteries.
Which would be the best measure of variability to use to compare the data?
Only Brand A data is symmetric, so standard deviation is the best measure to compare variability.
Only Brand B data is symmetric, so the median is the best measure to compare variability.
Both distributions are symmetric, so the mean is the best measure to compare variability.
Both distributions are skewed left, so the interquartile range is the best measure to compare variability.

Answers: 3


Another question on Mathematics
Mathematics, 21.06.2019 21:30
Consider the following equation. 1/2x^3+x-7=-3sqrtx-1 approximate the solution to the equation using three iterations of successive approximation. use the graph below as a starting point. a. b. c. d.
Answers: 3
Mathematics, 21.06.2019 23:30
Find each value of the five-number summary for this set of data. [note: type your answers as numbers. do not round.] 150, 120, 136, 180, 158, 175, 124, 162 minimum maximum median upper quartile lower quartile
Answers: 1
You know the right answer?
The table shows the battery lives, in hours, of ten Brand A batteries and ten Brand B batteries.
Wh...
Questions


Mathematics, 06.12.2019 14:31


Mathematics, 06.12.2019 14:31
Mathematics, 06.12.2019 14:31
Biology, 06.12.2019 14:31

Mathematics, 06.12.2019 14:31

English, 06.12.2019 14:31


Social Studies, 06.12.2019 14:31
History, 06.12.2019 14:31


