
Mathematics, 11.10.2020 14:01 JocelynC24
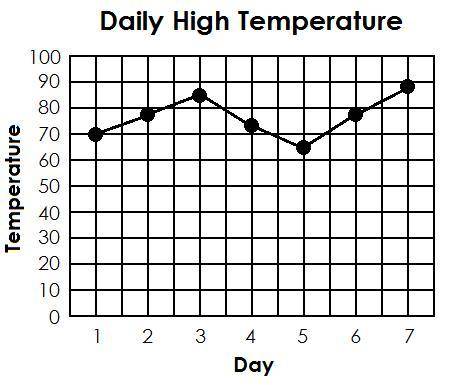
Stephanie collected data about the high temperature in her city for 7 days in a row. The high temperatures for the 7 days were 70, 78, 85, 73, 65, 78, and 89. She made the following graph to show her data.
She says the temperature in her city is pretty consistent, How could she redraw the graph so that the daily temperature doesnt seem quite so consistent?
(Not a multiple choice)

Answers: 2


Another question on Mathematics
Mathematics, 21.06.2019 15:00
What are the coordinates of the point is 1/4 of the way from a (-6, -3) to b (6, 1)? a. (-3, -2) b. (0, -2) c. (-1, 0) d. (3, 2)
Answers: 1
Mathematics, 21.06.2019 19:10
What is the quotient of m^6/5 ÷ 5/m^2? assume m does not equal pl
Answers: 1
You know the right answer?
Stephanie collected data about the high temperature in her city for 7 days in a row. The high temper...
Questions


Social Studies, 04.04.2020 04:52

Mathematics, 04.04.2020 04:53

Physics, 04.04.2020 04:53
Biology, 04.04.2020 04:53

Mathematics, 04.04.2020 04:53

History, 04.04.2020 04:53

Computers and Technology, 04.04.2020 04:53
Mathematics, 04.04.2020 04:53
Social Studies, 04.04.2020 04:53


