
Mathematics, 05.10.2020 03:01 robertstoll81
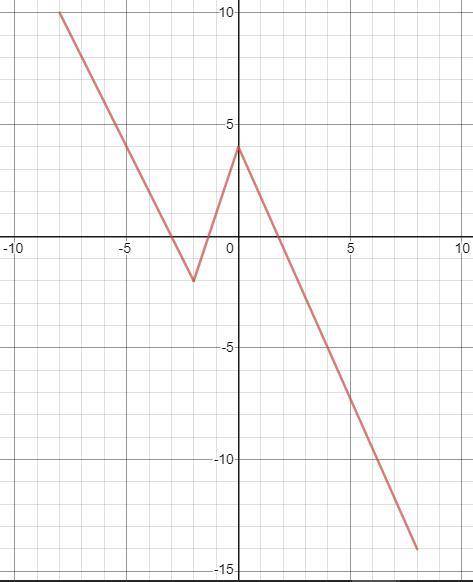
The graph of f(x) is shown below.
For each point (a, b) on the graph of y = f(x), the point ( 3a - 1, b/2) is plotted to form the graph of another function y = g(x). For example, (0,2) lies on the graph of y = f(x), so (3 x 0 - 1, 2/2) = (-1,1) lies on the graph of y = g(x).
(a) Plot the graph of y = g(x). Include the diagram in your solution.
(b) Express g(x) in terms of f(x).
(c) Describe the transformations that you would apply to the graph of y = f(x) to obtain the graph of y = g(x). For example, one transformation might be to stretch the graph horizontally by a factor of 5.

Answers: 1


Another question on Mathematics
Mathematics, 22.06.2019 00:00
When a 757 passenger jet begins its descent to the ronald reagan national airport in washington, d.c., it is 3900 feet from the ground. its angle of descent is 6 degrees. how far must the plane fly to reach the run way? a. 37,106 ft b. 37,310.4 ft c. 23,456.6 ft d 2,492.7 ft
Answers: 2
Mathematics, 22.06.2019 02:30
The upcoming championship high school football game is a big deal in your little town. the problem is, it is being played in the next biggest town, which is two hours away! to get as many people as you can to attend the game, you decide to come up with a ride-sharing app, but you want to be sure it will be used before you put all the time in to creating it. you determine that if more than three students share a ride, on average, you will create the app. you conduct simple random sampling of 20 students in a school with a population of 300 students to determine how many students are in each ride-share (carpool) on the way to school every day to get a good idea of who would use the app. the following data are collected: 6 5 5 5 3 2 3 6 2 2 5 4 3 3 4 2 5 3 4 5 construct a 95% confidence interval for the mean number of students who share a ride to school, and interpret the results. part a: state the parameter and check the conditions. part b: construct the confidence interval. be sure to show all your work, including the degrees of freedom, critical value, sample statistics, and an explanation of your process. part c: interpret the meaning of the confidence interval. part d: use your findings to explain whether you should develop the ride-share app for the football game.
Answers: 3
Mathematics, 22.06.2019 03:10
Upstream: 1.04 = x – y downstream: 2.08 = x + y aro can paddle at a speed of miles per hour. the river’s speed is miles per hour.
Answers: 3
You know the right answer?
The graph of f(x) is shown below.
For each point (a, b) on the graph of y = f(x), the point ( 3a -...
Questions

Biology, 26.11.2019 23:31


Physics, 26.11.2019 23:31
History, 26.11.2019 23:31

World Languages, 26.11.2019 23:31

Biology, 26.11.2019 23:31

Social Studies, 26.11.2019 23:31
History, 26.11.2019 23:31
Mathematics, 26.11.2019 23:31

Biology, 26.11.2019 23:31
Mathematics, 26.11.2019 23:31
Mathematics, 26.11.2019 23:31


