
Mathematics, 20.09.2020 07:01 puchie1225
Need help asap An executive interested in cutting costs does a study on the weekly cost of heating the company's building to different temperatures during the winter. Here are the results Temperature (°F 65 72 67 70 62 60 74 Cost per Week (dollars) 330 435 370 395 305 285 450 Part A: Make a scatter plot of the data and determine the type of function that best models the data Explain Part B: Use a regression feature of a graphing calculator to find a function that models the data Graph the function and data to verify that the function is a good model. Does your model fit the data? Explain Par C: Use your model to predict the cost per week to heat the building to 68°F

Answers: 2


Another question on Mathematics
Mathematics, 21.06.2019 18:00
Factor x2 – 8x + 15. which pair of numbers has a product of ac and a sum of what is the factored form of the
Answers: 1
Mathematics, 21.06.2019 23:30
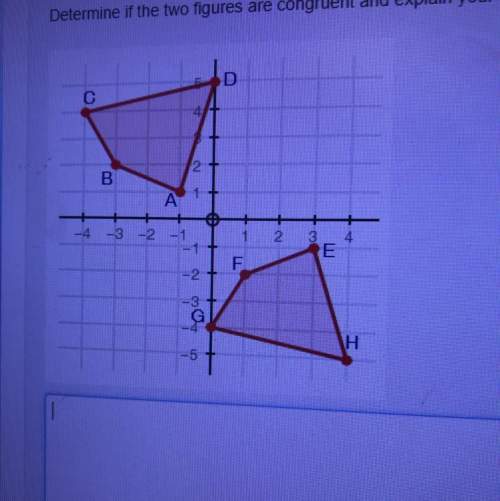
Asap (i need to finish this quick) graph complete the sequence of transformations that produces △x'y'z' from △xyz. a clockwise rotation ° about the origin followed by a translation units to the right and 6 units down produces δx'y'z' from δxyz.
Answers: 1
Mathematics, 22.06.2019 02:00
Nina has prepared the following two-column proof below. she is given that ∠oln ≅ ∠lno and she is trying to prove that ol ≅ on. triangle oln, where angle oln is congruent to angle lno nina made two errors in the proof. identify and correct the errors.
Answers: 1
Mathematics, 22.06.2019 03:00
Describe how the presence of possible outliers might be identified on the following. (a) histograms gap between the first bar and the rest of bars or between the last bar and the rest of bars large group of bars to the left or right of a gap higher center bar than surrounding bars gap around the center of the histogram higher far left or right bar than surrounding bars (b) dotplots large gap around the center of the data large gap between data on the far left side or the far right side and the rest of the data large groups of data to the left or right of a gap large group of data in the center of the dotplot large group of data on the left or right of the dotplot (c) stem-and-leaf displays several empty stems in the center of the stem-and-leaf display large group of data in stems on one of the far sides of the stem-and-leaf display large group of data near a gap several empty stems after stem including the lowest values or before stem including the highest values large group of data in the center stems (d) box-and-whisker plots data within the fences placed at q1 â’ 1.5(iqr) and at q3 + 1.5(iqr) data beyond the fences placed at q1 â’ 2(iqr) and at q3 + 2(iqr) data within the fences placed at q1 â’ 2(iqr) and at q3 + 2(iqr) data beyond the fences placed at q1 â’ 1.5(iqr) and at q3 + 1.5(iqr) data beyond the fences placed at q1 â’ 1(iqr) and at q3 + 1(iqr)
Answers: 1
You know the right answer?
Need help asap
An executive interested in cutting costs does a study on the weekly cost of heating...
Questions


Mathematics, 04.07.2020 01:01
Mathematics, 04.07.2020 01:01
Mathematics, 04.07.2020 01:01


