
Mathematics, 20.09.2020 04:01 jungcoochie101
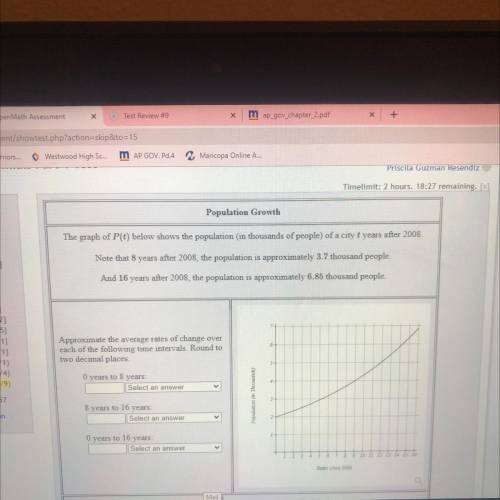
The graph of P(t) below shows the population in thousands of people) of a city t years after 2008
Note that 8 years after 2008, the population is approximately 3.7 thousand people.
And 16 years after 2008, the population is approximately 6.85 thousand people.
Approximate the average rates of change over
each of the following time intervals. Round to
two decimal places
6
0 years to 8 years:
Select an answer
Population ( 7 )
8 years to 16 years:
Select an answer
O years to 16 years:
Select an answer
13 14 15 16
Years since 2003

Answers: 1


Another question on Mathematics
Mathematics, 21.06.2019 16:30
The temperature of chicken soup is 192.7°f. as it cools, the temperature of the soup decreases 2.3°f per minute. what is the temperature in degrees fahrenheit of the soup after 25 minutes? a. 27.3°f b. 57.5°f c. 135.2°f d. 250.2°f
Answers: 1
Mathematics, 21.06.2019 18:30
Iam a rectangle. my perimeter is 60 feet. how much are do i cover?
Answers: 1
Mathematics, 21.06.2019 18:40
Acircle has a circumference of 28.36 units what is the diameter of the circle
Answers: 2
Mathematics, 22.06.2019 00:00
The function y= x - 4x+ 5 approximates the height, y, of a bird, and its horizontal distance, x, as it flies from one fence post to another. all distances are in feet. complete the square to find and interpret the extreme value (vertex). select two answers: one extreme value and one interpretation.
Answers: 2
You know the right answer?
The graph of P(t) below shows the population in thousands of people) of a city t years after 2008...
Questions
Mathematics, 27.08.2020 01:01
Mathematics, 27.08.2020 01:01
Mathematics, 27.08.2020 01:01
Mathematics, 27.08.2020 01:01

English, 27.08.2020 01:01
Mathematics, 27.08.2020 01:01
Mathematics, 27.08.2020 01:01
Mathematics, 27.08.2020 01:01

Biology, 27.08.2020 01:01

History, 27.08.2020 01:01
Mathematics, 27.08.2020 01:01
Mathematics, 27.08.2020 01:01
Mathematics, 27.08.2020 01:01
Mathematics, 27.08.2020 01:01
Mathematics, 27.08.2020 01:01


