
Mathematics, 20.08.2020 01:01 shaelyn0920
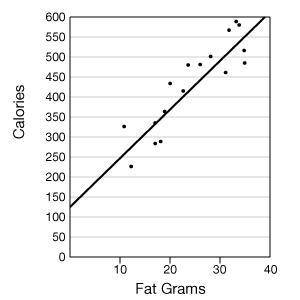
100 POINTS! WILL MARK BRAINLIEST. NEED HELP BAD. 1. Collect data from several fast food chains on the number of fat calories and grams of saturated fat in menu items. Record at least 12 ordered pairs of (fat calories, grams of saturated fat). Organize your data in a table. 2. Make a scatter plot of the data on graph paper. Be sure to label the axes and use an appropriate title for the graph. You may wish to use a graphing calculator, spread sheet, or other technology resource (such as the graphing utility link below) to aid you in graphing. Create a Graph 3. Draw a trend line for the scatter plot. Use the following scatter plot of the ordered pairs (fat grams, total calories) as an example. 4. Calculate the slope of the trend line. (Choose two points on the line and find vertical change over horizontal change.) Note: Graphing calculators and spread sheets have features with which to draw trend lines and determine the equation. You may choose to use one of these options. If you use technology, indicate what steps were taken to arrive at your equation. 5. Using the slope and y-intercept, write the equation of the trend line ( y = mx + b). 6. Choose a "calories from fat" value that is not in your collected data set and that is at least 10 fat calories away from any collected value. Use the equation calculated in step 5 to predict the number of fat grams in an item having that number of fat calories. Be sure to show your work. 7. Search for an item in a fast food menu having the same number of fat calories as the one you chose above. (If you cannot find the exact value, get as close as you can.) Compare the calculated value from step 6 to this actual value. Explain why (or why not) you would have expected your prediction (calculated value) to be close to the actual value.

Answers: 2


Another question on Mathematics
Mathematics, 21.06.2019 20:30
Someone answer asap for ! a ball is rolled down a ramp. the height, f(x), in meters, of the ball x seconds after it is released is modeled by the function f(x) = x²- 10x + 25 for all values of x from 0 to 5. which statement about the ball is true? a. the maximum height of the ball is 5 meters b. the height of the ball increases from 0 to 5 meters above the ground. c. the ball has traveled 5 meters when it reaches the bottom of the ramp. d. the ball has been traveling for 5 seconds when it reaches the bottom of the ramp
Answers: 1
Mathematics, 21.06.2019 22:30
According to the 2008 u.s. census, california had a population of approximately 4 × 10^7 people and florida had a population of approximately 2 × 10^7 people. which of the following is true? a. the population of california was approximately two times the population of florida. b. the population of florida was approximately twenty times the population of california. c. the population of florida was approximately two times the population of california. d. the population of california was approximately twenty times the population of florida.
Answers: 1
Mathematics, 22.06.2019 03:30
Given the equation  = 5, solve for x and identify if it is an extraneous solution
Answers: 2
You know the right answer?
100 POINTS! WILL MARK BRAINLIEST. NEED HELP BAD. 1. Collect data from several fast food chains on th...
Questions


Computers and Technology, 06.03.2020 05:58

English, 06.03.2020 05:58
Chemistry, 06.03.2020 05:58

English, 06.03.2020 05:59


