
Mathematics, 28.07.2020 17:01 yaneli0717
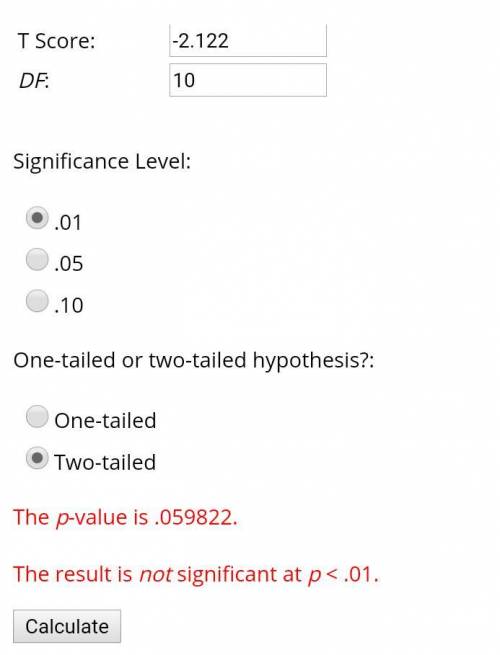
A facilities manager at a university reads in a research report that the mean amount of time spent in the shower by an adult is 5 minutes. He decides to collect data to see if the mean amount of time that college students spend in the shower is significantly different from 5 minutes. In a sample of 11 students, he found the average time was 4.52 minutes and the standard deviation was 0.75 minutes. Using this sample information, conduct the appropriate hypothesis test at the 0.1 level of significance. Assume normality. (can you please show how to do this without a calculator or excel i just dont want answer but want to know how to do it).
a) What are the appropriate null and alternative hypotheses?
A) H0: μ = 5 versus Ha: μ < 5
B) H0: μ = 5 versus Ha: μ ≠ 5
C) H0: x = 5 versus Ha: x ≠ 5
D) H0: μ = 5 versus Ha: μ > 5
b) What is the test statistic? Give your answer to four decimal places.
c) What is the P-value for the test? Give your answer to four decimal places.
d) What is the appropriate conclusion?
A) Fail to reject the claim that the mean time is 5 minutes because the P-value is larger than 0.01.
B) Reject the claim that the mean time is 5 minutes because the P-value is larger than 0.01.
C) Reject the claim that the mean time is 5 minutes because the P-value is smaller than 0.01.
D) Fail to reject the claim that the mean time is 5 minutes because the P-value is smaller than 0.01.

Answers: 1


Another question on Mathematics
Mathematics, 21.06.2019 13:40
Use the distance formula to determine the distance that point q is from r on the hypotenusebased on a 2-3 ratio.i need asap !
Answers: 3
Mathematics, 21.06.2019 16:00
5× 1/2 = ? a) more than 5 because you are multiplying by a whole number b) 5/10 because you multiply the numerator and denominator by 5 c) less than 5 because you are multiplying by a number that is more than 1 d) less than 5 because you are multiplying by a number that is less than 1
Answers: 3
Mathematics, 21.06.2019 20:30
List x1, x2, x3, x4 where xi is the left endpoint of the four equal intervals used to estimate the area under the curve of f(x) between x = 4 and x = 6. a 4, 4.5, 5, 5.5 b 4.5, 5, 5.5, 6 c 4.25, 4.75, 5.25, 5.75 d 4, 4.2, 5.4, 6
Answers: 1
Mathematics, 22.06.2019 00:30
When you flip a biased coin the probability of getting a tail is 0.6. how many times would you expect to get tails if you flip the coin 320 times?
Answers: 1
You know the right answer?
A facilities manager at a university reads in a research report that the mean amount of time spent i...
Questions


Physics, 03.06.2021 06:30

English, 03.06.2021 06:30
Mathematics, 03.06.2021 06:30
Chemistry, 03.06.2021 06:30
Chemistry, 03.06.2021 06:30

History, 03.06.2021 06:30
Chemistry, 03.06.2021 06:30
Mathematics, 03.06.2021 06:30
Mathematics, 03.06.2021 06:30
Mathematics, 03.06.2021 06:30


