
Mathematics, 23.07.2020 02:01 amf14
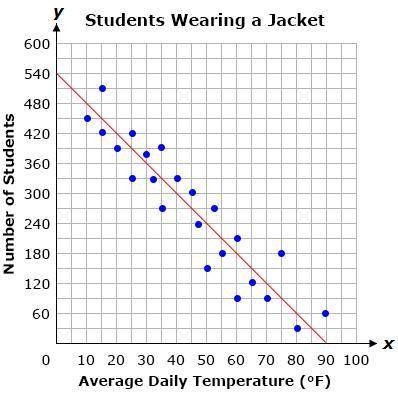
The graph below shows a line of best fit for data collected on the number of students who wear a jacket to school and the average daily temperature in degrees Fahrenheit.
Based on the line of best fit, how many students wear a jacket to school when the temperature is 50°F?
A.) 240
B.) 210
C.) 300
D.) 180

Answers: 3


Another question on Mathematics
Mathematics, 21.06.2019 16:20
Refer to interactive solution 17.45 to review a method by which this problem can be solved. the fundamental frequencies of two air columns are the same. column a is open at both ends, while column b is open at only one end. the length of column a is 0.504 m. what is the length of column b?
Answers: 1
Mathematics, 21.06.2019 18:50
Which of the following values cannot be probabilities? 0.08, 5 divided by 3, startroot 2 endroot, negative 0.59, 1, 0, 1.44, 3 divided by 5 select all the values that cannot be probabilities. a. five thirds b. 1.44 c. 1 d. startroot 2 endroot e. three fifths f. 0.08 g. 0 h. negative 0.59
Answers: 2
You know the right answer?
The graph below shows a line of best fit for data collected on the number of students who wear a jac...
Questions

Biology, 16.12.2021 16:40

World Languages, 16.12.2021 16:40


Chemistry, 16.12.2021 16:40
Mathematics, 16.12.2021 16:40
SAT, 16.12.2021 16:50
SAT, 16.12.2021 16:50

Biology, 16.12.2021 16:50

Chemistry, 16.12.2021 16:50
Mathematics, 16.12.2021 16:50

English, 16.12.2021 16:50


