
Mathematics, 20.07.2020 07:01 cvvalle15
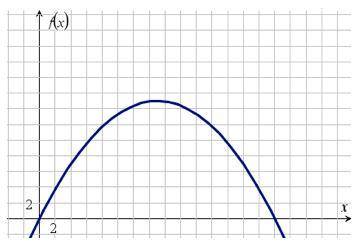
The graph below shows the height of a kicked soccer ball f(x), in feet, depending on the distance from the kicker x, in feet: Graph of quadratic function f of x having x intercepts at ordered pairs 0, 0 and 30, 0. The vertex is at 15, 15. Part A: What do the x-intercepts and maximum value of the graph represent? What are the intervals where the function is increasing and decreasing, and what do they represent about the distance and height? Part B: What is an approximate average rate of change of the graph from x = 22 to x = 26, and what does this rate represent?

Answers: 2


Another question on Mathematics
Mathematics, 21.06.2019 15:30
You have 6 dollars +12 pennies +to quarters + 4 dimes=2 nickels how much do you have
Answers: 1
Mathematics, 22.06.2019 04:20
The amount of calories consumed by customers at the chinese buffet is normally distributed with mean 2743 and standard deviation 652. one randomly selected customer is observed to see how many calories x that customer consumes. round all answers to 4 decimal places where possible. a. what is the distribution of x? x ~ n(correct,correct) b. find the probability that the customer consumes less than 2355 calories. incorrect c. what proportion of the customers consume over 3026 calories? incorrect d. the piggy award will given out to the 1% of customers who consume the most calories. what is the fewest number of calories a person must consume to receive the piggy award? incorrect calories. (round to the nearest calorie)
Answers: 3
Mathematics, 22.06.2019 04:30
Aski resort is charging $37.50 to rent a snowmobile for 5 hours. at this rate what will be the cost for a family of 5 to rent snowmobiles for 3 hours on the first day of their vacation and 4 hours for on the last day of their vacation
Answers: 1
You know the right answer?
The graph below shows the height of a kicked soccer ball f(x), in feet, depending on the distance fr...
Questions
Mathematics, 16.12.2019 17:31
Mathematics, 16.12.2019 17:31


English, 16.12.2019 17:31

History, 16.12.2019 17:31


Chemistry, 16.12.2019 17:31
Mathematics, 16.12.2019 17:31

Biology, 16.12.2019 17:31


