
Mathematics, 15.07.2020 01:01 almadimas16
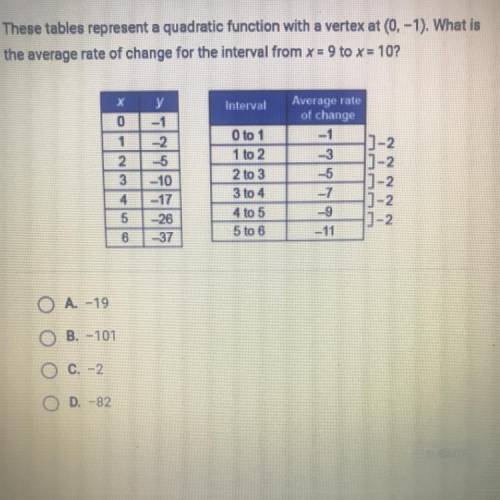
These tables represent a quadratic function with a vertex at (0, -1). What is
the average rate of change for the interval from x = 9 to x = 10?
х
Interval
0
1
2
3
y
-1
-2
-5
-10
-17
-26
O to 1
1 to 2
2 to 3
3 to 4
4 to 5
5 to 6
Average rate
of change
-1
3-2
-3
3-2
-5
1]-2
-7
-9
1-2
-11
1]-2
4
5
6
-37
A. -19
B.-101
C. -2
D. -82

Answers: 2


Another question on Mathematics
Mathematics, 22.06.2019 02:00
Robert plans to make a box-and-whisker plot of the following set of data. 27, 14, 46, 38, 32, 18, 21 find the lower quartile, the median, and the upper quartile of the set? lower quartile: 19.5; median: 29.5; upper quartile: 42 lower quartile: 14; median: 27; upper quartile: 46 lower quartile: 18; median: 27; upper quartile: 38 lower quartile: 16; median: 29.5; upper quartile: 42
Answers: 3
Mathematics, 22.06.2019 05:30
You leave a $4 tip on a $24 bill at a resturaunt. to the nearest percent gratuity did you pay
Answers: 1
You know the right answer?
These tables represent a quadratic function with a vertex at (0, -1). What is
the average rate of c...
Questions


Mathematics, 27.02.2020 01:27


Physics, 27.02.2020 01:27


History, 27.02.2020 01:27

Computers and Technology, 27.02.2020 01:27

Mathematics, 27.02.2020 01:28
Computers and Technology, 27.02.2020 01:28


