
Mathematics, 06.07.2020 01:01 ccarwile01
QUESTION 4
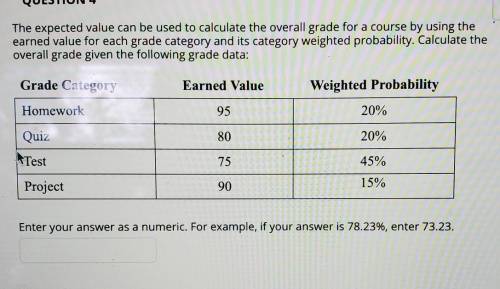
The expected value can be used to calculate the overall grade for a course by using the
earned value for each grade category and its category weighted probability. Calculate the
overall grade given the following grade data:
Grade Category
Earned Value
Weighted Probability
Homework
95
20%
Quiz
80
20%
Test
75
45%
Project
90
15%
Enter your answer as a numeric. For example, if your answer is 78.23%, enter 73.23.

Answers: 1


Another question on Mathematics
Mathematics, 21.06.2019 19:20
Aefg - almn. find the ratio of aefg to almn. a)1: 4 b)1: 2 c)2.1 d)4: 1
Answers: 1
Mathematics, 21.06.2019 23:30
Aprisoner is trapped in a cell containing three doors. the first door leads to a tunnel that returns him to his cell after two days of travel. the second leads to a tunnel that returns him to his cell after three days of travel. the third door leads immediately to freedom. (a) assuming that the prisoner will always select doors 1, 2 and 3 with probabili- ties 0.5,0.3,0.2 (respectively), what is the expected number of days until he reaches freedom? (b) assuming that the prisoner is always equally likely to choose among those doors that he has not used, what is the expected number of days until he reaches freedom? (in this version, if the prisoner initially tries door 1, for example, then when he returns to the cell, he will now select only from doors 2 and 3.) (c) for parts (a) and (b), find the variance of the number of days until the prisoner reaches freedom. hint for part (b): define ni to be the number of additional days the prisoner spends after initially choosing door i and returning to his cell.
Answers: 1
Mathematics, 22.06.2019 02:00
Ethan is proving that the slope between any two points on a straight line is the same. he has already proved that triangles 1 and 2 are similar. drag statements and reasons to complete the proof.
Answers: 1
Mathematics, 22.06.2019 02:20
There are two major tests of readiness for college: the act and the sat. act scores are reported on a scale from 1 to 36. the distribution of act scores in recent years has been roughly normal with mean µ = 20.9 and standard deviation s = 4.8. sat scores are reported on a scale from 400 to 1600. sat scores have been roughly normal with mean µ = 1026 and standard deviation s = 209. reports on a student's act or sat usually give the percentile as well as the actual score. the percentile is just the cumulative proportion stated as a percent: the percent of all scores that were lower than this one. tanya scores 1260 on the sat. what is her percentile (± 1)?
Answers: 1
You know the right answer?
QUESTION 4
The expected value can be used to calculate the overall grade for a course by using the<...
Questions
Mathematics, 02.06.2020 05:58
Mathematics, 02.06.2020 05:58
Mathematics, 02.06.2020 05:58


English, 02.06.2020 05:58

Mathematics, 02.06.2020 05:58


