
Mathematics, 01.07.2020 15:01 jamesmcfarland
A research report claims that 20% of all individuals use Firefox to browse the web. A software company is trying to determine if the proportion of their users who use Firefox is significantly different from 0.2. In a sample of 200 of their users, 32 users stated that they used Firefox. Using this data, conduct the appropriate hypothesis test using a 0.05 level of significance.
a) What are the appropriate hypotheses?
H0: p = 0.2 versus Ha: p < 0.2
H0: p = 0.2 versus Ha: p > 0.2
H0: p = 0.2 versus Ha: p ? 0.2
H0: ? = 0.2 versus Ha: ? > 0.2
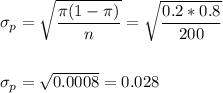
b) What is the test statistic? Give your answer to four decimal places.
c) What is the P-value for the test? Give your answer to four decimal places.
d) What is the appropriate conclusion?
1. Conclude that the Firefox proportion is not 0.2 because the P-value is smaller than 0.05.
2. Conclude that the Firefox proportion is not 0.2 because the P-value is larger than 0.05.
3. Fail to reject the claim that the Firefox proportion is 0.2 because the P-value is larger than 0.05.
4. Fail to reject the claim that the Firefox proportion is 0.2 because the P-value is smaller than 0.05.

Answers: 1


Another question on Mathematics
Mathematics, 21.06.2019 19:00
Find the y-intercept and x-intercept for the equation 5x-3y=60 what is the y-intercept
Answers: 1
Mathematics, 21.06.2019 19:30
Acar started driving from city a to city b, distance between which is 620 miles, at a rate of 60 mph. two hours later a truck left city b and started moving towards city a at a rate of 40 mph. what distance from city a is the point where the truck and the car will meet?
Answers: 1
Mathematics, 21.06.2019 22:00
Find the maximum value of p= 4x + 5y subject to the following constraints :
Answers: 3
Mathematics, 22.06.2019 01:30
Here are the 30 best lifetime baseball batting averages of all time, arranged in order from lowest to highest: 0.319, 0.329, 0.330, 0.331, 0.331, 0.333, 0.333, 0.333, 0.334, 0.334, 0.334, 0.336, 0.337, 0.338, 0.338, 0.338, 0.340, 0.340, 0.341, 0.341, 0.342, 0.342, 0.342, 0.344, 0.344, 0.345, 0.346, 0.349, 0.358, 0.366 if you were to build a histogram of these data, which of the following would be the best choice of classes?
Answers: 3
You know the right answer?
A research report claims that 20% of all individuals use Firefox to browse the web. A software compa...
Questions
Mathematics, 09.09.2020 08:01

Social Studies, 09.09.2020 08:01
Mathematics, 09.09.2020 08:01
Mathematics, 09.09.2020 08:01
Mathematics, 09.09.2020 08:01
Mathematics, 09.09.2020 08:01
Mathematics, 09.09.2020 08:01
Mathematics, 09.09.2020 08:01
Mathematics, 09.09.2020 08:01
Mathematics, 09.09.2020 08:01
Mathematics, 09.09.2020 08:01
Mathematics, 09.09.2020 08:01
Mathematics, 09.09.2020 08:01
Mathematics, 09.09.2020 08:01

French, 09.09.2020 08:01
Mathematics, 09.09.2020 08:01

English, 09.09.2020 08:01
Mathematics, 09.09.2020 08:01
English, 09.09.2020 08:01
Mathematics, 09.09.2020 08:01


