
Mathematics, 26.06.2020 15:01 genyjoannerubiera
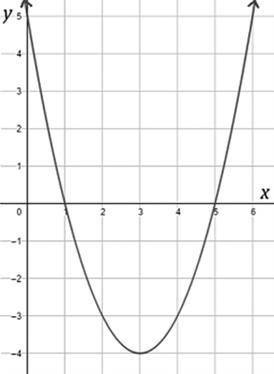
What are the features of the quadratic function graphed in the figure? Question 1 options: A) Vertex = (–4,3), y-intercept = (5,0), x-intercepts = (0,1) and (0,5), axis of symmetry is x = –4 B) Vertex = (3,–4), y-intercept = (0,5), x-intercepts = (1,0) and (5,0), axis of symmetry is x = 3 C) Vertex = (3,–4), y-intercepts = (1,0) and (5,0), x-intercept = (0,5), axis of symmetry is x = 3 D) Vertex = (–3,4), y-intercept = (0,5), x-intercepts = (1,0) and (5,0), axis of symmetry is x = –3

Answers: 2


Another question on Mathematics
Mathematics, 21.06.2019 13:30
Write an equation of the line given the two points below (write your equation in slope-intercept form, y=mx+b): (-4, 4) and (6, -4)
Answers: 2
Mathematics, 22.06.2019 00:00
I've been working on this for a few days and i just don't understand, it's due in a few hours. you.the direction of a vector is defined as the angle of the vector in relation to a horizontal line. as a standard, this angle is measured counterclockwise from the positive x-axis. the direction or angle of v in the diagram is α.part a: how can you use trigonometric ratios to calculate the direction α of a general vector v = < x, y> similar to the diagram? part bsuppose that vector v lies in quadrant ii, quadrant iii, or quadrant iv. how can you use trigonometric ratios to calculate the direction (i.e., angle) of the vector in each of these quadrants with respect to the positive x-axis? the angle between the vector and the positive x-axis will be greater than 90 degrees in each case.part cnow try a numerical problem. what is the direction of the vector w = < -1, 6 > ?
Answers: 1
Mathematics, 22.06.2019 02:40
Perform the indicated operation and write the answer in the form a + bi. (-5 + 2) + (3 - 6i)
Answers: 3
Mathematics, 22.06.2019 03:00
Describe how the presence of possible outliers might be identified on the following. (a) histograms gap between the first bar and the rest of bars or between the last bar and the rest of bars large group of bars to the left or right of a gap higher center bar than surrounding bars gap around the center of the histogram higher far left or right bar than surrounding bars (b) dotplots large gap around the center of the data large gap between data on the far left side or the far right side and the rest of the data large groups of data to the left or right of a gap large group of data in the center of the dotplot large group of data on the left or right of the dotplot (c) stem-and-leaf displays several empty stems in the center of the stem-and-leaf display large group of data in stems on one of the far sides of the stem-and-leaf display large group of data near a gap several empty stems after stem including the lowest values or before stem including the highest values large group of data in the center stems (d) box-and-whisker plots data within the fences placed at q1 â’ 1.5(iqr) and at q3 + 1.5(iqr) data beyond the fences placed at q1 â’ 2(iqr) and at q3 + 2(iqr) data within the fences placed at q1 â’ 2(iqr) and at q3 + 2(iqr) data beyond the fences placed at q1 â’ 1.5(iqr) and at q3 + 1.5(iqr) data beyond the fences placed at q1 â’ 1(iqr) and at q3 + 1(iqr)
Answers: 1
You know the right answer?
What are the features of the quadratic function graphed in the figure? Question 1 options: A) Vertex...
Questions

History, 19.12.2019 13:31

Social Studies, 19.12.2019 13:31

History, 19.12.2019 13:31

Health, 19.12.2019 13:31

Biology, 19.12.2019 13:31
Mathematics, 19.12.2019 13:31
History, 19.12.2019 13:31
Mathematics, 19.12.2019 13:31
Mathematics, 19.12.2019 13:31

Mathematics, 19.12.2019 13:31


