
Mathematics, 25.06.2020 06:01 shusemann
A local store developed a multiplicative time-series model to forecast its revenues in future quarters, using quarterly data on its revenues during the 5-year period from 2008 to 2012. The following is the resulting regression equation: log10 = 6.102 + 0.012 X - 0.129 Q1 - 0.054 Q2 + 0.098 Q3 where is the estimated number of contracts in a quarter X is the coded quarterly value with X = 0 in the first quarter of 2008 Q1 is a dummy variable equal to 1 in the first quarter of a year and 0 otherwise Q2 is a dummy variable equal to 1 in the second quarter of a year and 0 otherwise Q3 is a dummy variable equal to 1 in the third quarter of a year and 0 otherwise To obtain a fitted value for the fourth quarter of 2009 using the model, which of the following sets of values should be used in the regression equation?1. In testing the significance of the coefficient of X in the regression equation (0.012) which has a p-value of 0.02. Which of the following is the best interpretation of this result? a. The quarterly growth rate in revenues is significantly different from 0%. b. The quarterly growth rate in revenues is not significantly different from 0%. c. The quarterly growth rate in revenues is significantly different from 1.2%. d. The quarterly growth rate in revenues is not significantly different from 1.2%. e. The quarterly growth rate in revenues is significantly different from 1.2% 2. using the regression equation, the forecast for the revenues in the fourth quarter of 2004 is: a. 6,426 b. 2,666,858 c. 6,638 d. 2,741,574 e. 6,414

Answers: 3

 The quarterly growth rate in revenues is not significantly different from 1.2%.
 The quarterly growth rate in revenues is significantly different from 1.2%.
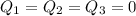 ; X = 27
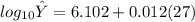
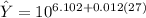
 2666858.665

Another question on Mathematics
Mathematics, 21.06.2019 16:00
Select the correct answer. in the figure, angle k measures 45°. what is the measurement of angle c? a. 38° b. 45° c. 90° d. 98°
Answers: 2
Mathematics, 21.06.2019 18:30
At the olympic games, many events have several rounds of competition. one of these events is the men's 100-meter backstroke. the upper dot plot shows the times (in seconds) of the top 8 finishers in the final round of the 2012 olympics. the lower dot plot shows the times of the same 8 swimmers, but in the semifinal round. which pieces of information can be gathered from these dot plots? (remember that lower swim times are faster.) choose all answers that apply: a: the swimmers had faster times on average in the final round. b: the times in the final round vary noticeably more than the times in the semifinal round. c: none of the above.
Answers: 2
Mathematics, 21.06.2019 23:00
Car a and car b were in a race .the driver of car b claimed that his car was twice as fast as car a
Answers: 3
You know the right answer?
A local store developed a multiplicative time-series model to forecast its revenues in future quarte...
Questions
Mathematics, 26.04.2021 14:00
Mathematics, 26.04.2021 14:00
Mathematics, 26.04.2021 14:00

English, 26.04.2021 14:00


World Languages, 26.04.2021 14:00
Mathematics, 26.04.2021 14:00
Mathematics, 26.04.2021 14:00
World Languages, 26.04.2021 14:00
Mathematics, 26.04.2021 14:00

French, 26.04.2021 14:00
Mathematics, 26.04.2021 14:00
Mathematics, 26.04.2021 14:00


Chemistry, 26.04.2021 14:00
Mathematics, 26.04.2021 14:00


