
Mathematics, 18.06.2020 21:57 jackieanguiano4758
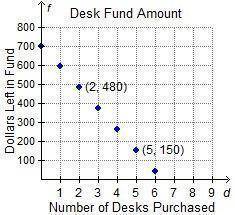
The graph below shows the amount of money left in the school’s desk fund, f, after d desks have been purchased. A graph titled Desk Fund Amount. The horizontal axis shows the number of desks purchased (d), numbered 1 to 9, and the vertical axis shows the dollars left in fund (f) numbered 100 to 800. Blue diamonds appear at points (0, 700), (1, 590), (2, 480), (3, 370), (4, 260), (5, 150), (6, 40). For each new desk that is purchased, by how much does the amount of money left in the school’s desk fund decrease? $110 $135 $165 $190

Answers: 1


Another question on Mathematics
Mathematics, 21.06.2019 17:00
Tiffany drives 285,120 feet before lunch and 628,320 feet after lunch. about how many kilometers does she drive all together
Answers: 1
Mathematics, 21.06.2019 19:00
Sanya noticed that the temperature was falling at a steady rate of 1.4 degrees every hour from the time that she first checked her outdoor thermometer. by 6 a.m., the temperature had fallen 21 degrees. which expression can you use to find how many hours earlier she had first checked the thermometer?
Answers: 3
Mathematics, 21.06.2019 23:00
Which equation shows y= 3 4 x− 5 2 in standard form? a 4x−3y=10 b 3x−4y=10 c 3x−4y=−10 d 4x−3y=−10
Answers: 1
You know the right answer?
The graph below shows the amount of money left in the school’s desk fund, f, after d desks have been...
Questions

Computers and Technology, 15.10.2019 13:10

World Languages, 15.10.2019 13:10

Geography, 15.10.2019 13:10

Chemistry, 15.10.2019 13:10

Social Studies, 15.10.2019 13:10
Geography, 15.10.2019 13:10
Mathematics, 15.10.2019 13:10

English, 15.10.2019 13:10
Social Studies, 15.10.2019 13:10

History, 15.10.2019 13:10

Physics, 15.10.2019 13:10


History, 15.10.2019 13:10


