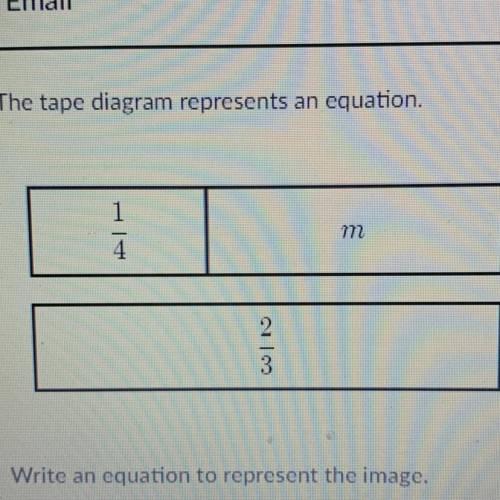
The tape diagram represents an equation.
m
4
3
Write an equation to represent the...

Mathematics, 09.06.2020 13:57 Jasten
The tape diagram represents an equation.
m
4
3
Write an equation to represent the image.

Answers: 2


Another question on Mathematics
Mathematics, 21.06.2019 20:50
These tables represent a quadratic function with a vertex at (0, -1). what is the average rate of change for the interval from x = 9 to x = 10?
Answers: 2
Mathematics, 22.06.2019 03:00
The graph of a quadratic function has a maximum at point (0, 5). the graph contains the point (2, 1). what is another point on the graph?
Answers: 1
Mathematics, 22.06.2019 04:10
Amy is plan her school's new basketball court. the west edge of the basketball court is located on the line y = 5x + 2. the east edge cannot intersect with the west edge. on which line could the east edge be located? −y − 5x = 100 y + 5x = 100 −5x − y = 50 5x − y = 50
Answers: 2
You know the right answer?
Questions


Mathematics, 01.12.2020 14:10


English, 01.12.2020 14:10
Mathematics, 01.12.2020 14:10
SAT, 01.12.2020 14:10

History, 01.12.2020 14:10
Mathematics, 01.12.2020 14:10


