Statistics MATH 2000 50490 Summer 2020 Section 07 Asynchronous
DeTrese Bowen & 05/24/20 2:...

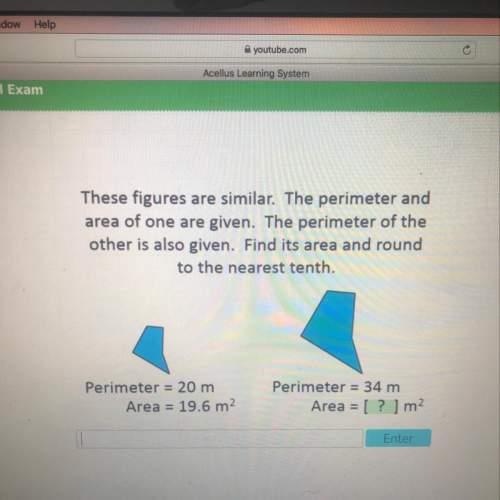
Mathematics, 25.05.2020 22:58 Becky323
Statistics MATH 2000 50490 Summer 2020 Section 07 Asynchronous
DeTrese Bowen & 05/24/20 2:39
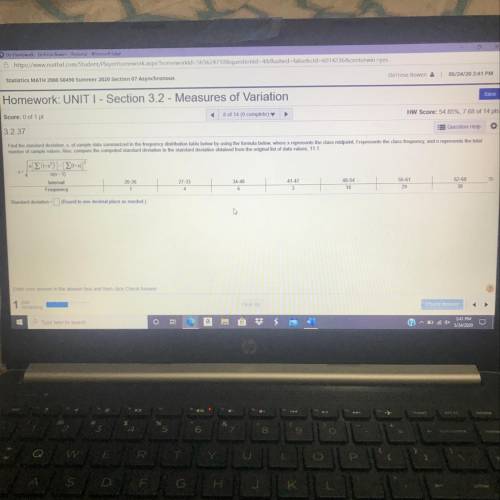
Homework: UNITI - Section 3.2 - Measures of Variation
Score: 0 of 1 pt
8 of 14 (9 complete)
HW Score: 54.85%, 768 of
3.2.37
Question Help
Find the standard deviation of sample data summarized in the frequency distribution table below by using the formula below where x represents the class midpoint, represents the class frequency, and in represents the total
number of sample values. Also, compare the computed standard deviation to the standard deviation obtained from the original list of data values, 11.1

Answers: 2


Another question on Mathematics
Mathematics, 21.06.2019 15:20
Beth took out a $20,000 loan for college she is borrowing money from two banks. bank a charges an interest rate of 8.5% bank b charges and interest rate of 10.5% after one year alice owes $1860 in interest how much money did she borrow from bank a
Answers: 3
Mathematics, 21.06.2019 16:30
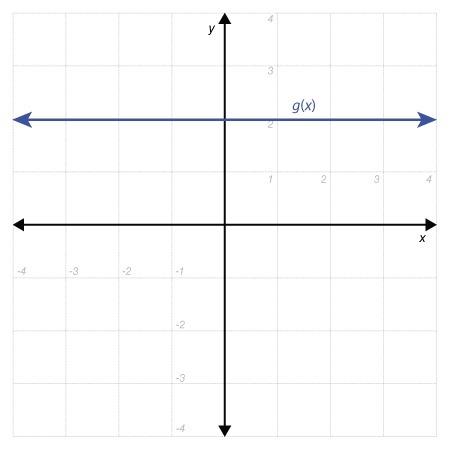
What is the name used to describe a graph where for some value of x, there exists 2 or more different values of y?
Answers: 2
You know the right answer?
Questions
Mathematics, 18.10.2020 04:01


Mathematics, 18.10.2020 04:01
Mathematics, 18.10.2020 04:01
Chemistry, 18.10.2020 04:01
English, 18.10.2020 04:01
Mathematics, 18.10.2020 04:01


History, 18.10.2020 04:01

Social Studies, 18.10.2020 04:01
History, 18.10.2020 04:01


